Based on BLS release dates; both boundary dates are included.
QQQ/SPY price reactions after CPI releases
An event study of 43 official U.S. CPI release events at 08:30 ET. Forty-two regular releases have comparable headline/core MoM surprise data; one special release remains in the event history but outside those buckets.
42 releases have comparable MoM surprise data; the special two-month release is retained separately.
Average absolute 15-minute price move after converting every release reaction to a positive magnitude.
The underlying medians are QQQ +0.0414% and SPY +0.0478%; this summary card rounds them to +0.04% and +0.05%.
Key findings
Key findings from the historical sample
Reaction windowUses the last pre-release price as the baseline and measures the selected number of minutes after the release.
- QQQ
- +0.38%Up in 77.8% of samples
- SPY
- +0.24%Up in 77.8% of samples
15m post-release price move median · 18 samples
- QQQ
- -0.07%Down in 61.5% of samples
- SPY
- -0.06%Down in 53.8% of samples
15m post-release price move median · 13 samples
+0.5bp
Median 15-minute relative return, QQQ minus SPY · average absolute relative return 7.0bp
Chapter 1 · CPI basics
Read CPI first, then follow how markets price it
These four sections form one reading path: what CPI measures, how the readings differ, why the surprise matters, and how that signal can reach Treasuries and equities.
What CPI measures
The Consumer Price Index is published monthly by the U.S. Bureau of Labor Statistics, usually at 8:30 a.m. ET. BLS began publishing separate city indexes in 1919, the national U.S. city average in 1921, and estimates extend back to 1913. Its basket covers food and beverages, housing, apparel, transportation, medical care, recreation, education and communication, and other goods and services.
Headline/Core, MoM/YoY
Headline CPI covers all items; core CPI excludes food and energy. Monthly readings show the latest change, while annual readings compare prices with the same month a year earlier.
- What is included?
- Headline = all items · Core = excludes food and energy
- Compared with when?
- MoM = previous month · YoY = same month one year earlier
Markets react to the surprise
Markets usually compare the released value with consensus expectations, then inspect revisions and underlying details. A reading can slow from the previous month but still be hotter than expected—or rise and still be cooler than expected. Those are different comparisons.
The core comparison
Illustrative YoY examples · not historical samplesActual−Consensus=Surprise
Inflation slowed, but was hotter than expected
Previous 3.0% → consensus 2.8% → actual 2.9%
Lower than before, but 0.1pp above consensusInflation rose, but was cooler than expected
Previous 2.7% → consensus 3.0% → actual 2.9%
Higher than before, but 0.1pp below consensusHow CPI can feed through to QQQ and SPY
In one line: a CPI surprise may change the expected path of rates, which may reprice short-end Treasuries and equity valuations. Start with that path, then use ZT to inspect the rate channel.
Start with the core path
- 01 · Data triggerCPI vs. consensus
Decide whether the headline and core MoM readings were cooler, in line, hotter, or mixed versus expectations.
- 02 · The channel we trackExpected path of rates
The market reassesses whether rates may stay high for longer or whether pressure for tight policy may ease.
- 03 · Bond-market signalZT · short-end Treasury pricing
ZT is the trading code for 2-Year U.S. Treasury Note futures. This page uses its minute-level price to observe short-end Treasury repricing in the same event window.
- 04 · Equity reactionQQQ / SPY
Higher rates can weigh on the present value of future profits. Growth-heavy QQQ is often more rate-sensitive than broad-market SPY.
CPI surprise tells us whether the release was cooler or hotter than expected. ZT shows how short-end Treasuries repriced. QQQ and SPY show how equities reacted.
Why observe the bond market too?
QQQ/SPY show the final equity move, but not whether the market repriced through the short-rate channel. ZT provides an intermediate market signal for that question; it is not a third research target.
Direction guideZT prices and short-end yields usually move in opposite directions
ZT price risesShort-end Treasury yields usually fall
ZT price fallsShort-end Treasury yields usually rise
Why do rates and ZT usually move in opposite directions?
- Markets expect the Fed to cut rates
- Future short-end rates may fall
- Existing fixed cash flows become more valuable
- Traders buy Treasuries or ZT · ZT usually rises
When markets expect future short-end rates to fall, existing fixed cash flows become more valuable, so Treasury prices and ZT usually rise. If rates are expected to stay high for longer, the direction is usually reversed.
ZT price ticks are not yield basis points. This page uses ZT to observe direction, not to convert futures ticks into an exact cash yield move.
Four common ways to read a CPI release
These labels compare the release with consensus—not simply with the previous month. They describe common repricing paths, not forecasts.
- 01Cooler than expectedHeadline and core MoM are both at or below consensus; at least one is lowerPressure for higher-for-longer rates may easeZT usually rises · short-end yields usually fallValuation pressure on QQQ/SPY may ease
- 02Hotter than expectedHeadline and core MoM are both at or above consensus; at least one is higherRates may need to stay high for longerZT usually falls · short-end yields usually riseQQQ/SPY valuations may come under pressure
- 03In lineActual CPI roughly matches consensusCore details, revisions, and positioning matter moreZT may show no clear directionThe equity reaction may be smaller or driven by other news
- 04MixedHeadline and core surprises point in opposite directionsThe rate-path message is conflictedDo not assume a ZT directionQQQ/SPY need event-specific context
Next, the page tests each link separately: CPI versus consensus, ZT short-end repricing, and the QQQ/SPY reaction.
Chapter 2 · Historical test
Official CPI release study
Chapter 1 described a possible CPI-to-market path. This chapter asks the historical question: across 43 official releases, what actually appeared in the price data?
The official-release sample looks very different from a broad inflation-news search. Across 43 release events, the median 15-minute return was QQQ +0.0414% and SPY +0.0478%, while QQQ's average absolute price move was 0.2780%. The middle 80% of QQQ reactions ranged from -0.2339% to +0.4930%. Forty-two regular releases enter the headline/core MoM surprise groups; the special Dec 18, 2025 release remains visible but is not forced into those buckets.
Research scope and primary sample
IncludedScheduled BLS CPI releases at 08:30 ET · one release date, one event-study sample
Context only
Broad inflation, Fed, oil, tariff, wage, and company-pricing headlines remain searchable context. They do not count as official CPI release samples.
1,587 broad inflation-news matches are available for context search and are not part of the official CPI release study- Complete history
- n=43official releases · overall statistics and full history
- Primary analysis sample
- n=42comparable releases · used by Chapter 3 groups and Chapter 4 comparable scatters
Research method and data quality
Open for price anchors, source provenance, ZT construction, tick math, and sensitivity checks.
- Sample contract
- 43 official releases enter the reaction study. 42 regular releases have comparable headline/core MoM surprises; the Dec 18, 2025 special two-month release remains in the history but outside those buckets.
- How price moves are calculated
- T0 is 08:30:00 ET. P0 is the close of the one-minute bar [08:29, 08:30); P(t) is the close of bars ending at 08:31, 08:35, 08:45, 09:00, and 09:30. The price move is P(t) / P0 - 1. The 60-minute point is the final pre-open state and excludes the cash open. If any P0 or P(t) bar has no fresh trade, the latest observed price is used. Every affected point is one minute stale; two P0 asset anchors and two P15 asset endpoints are affected.
- QQQ/SPY minute-price data
The 43 releases use the audited source periods below. Both inputs are trade-based one-minute OHLCV bars covering 04:00–20:00 ET, including premarket trading. Provider timestamps mark bar starts; this study selects and labels bars by their ending minute.
- Alpaca · SIP2023-01-01–2024-12-31 · 24 releases
market coverage: consolidated U.S. equities trades · adjustment: raw prices - Massive · U.S. equities aggregate bars2025-01-01–2026-06-25 · 17 releases
market coverage: provider consolidated U.S. equities aggregates · adjustment: split-adjusted prices - Alpaca · SIP2026-06-26–present · 2 releases
market coverage: consolidated U.S. equities trades · adjustment: raw prices - No-trade handlingWhen a selected minute has no fresh trade bar, the latest observed price is carried for at most one minute; QQQ and SPY endpoint staleness is recorded separately.
- Alpaca · SIP2023-01-01–2024-12-31 · 24 releases
- Actual and consensus
- Actual values use the archived BLS as-released vintage. Consensus comes from the cited historical report, not BLS. Source title, article time, retained-source count, and snapshot time are disclosed when recorded; missing metadata is labeled rather than inferred.
- P0 quality audit
- 41 releases have both QQQ/SPY P0 anchors directly observed; 40 of them are MoM-comparable. These counts document baseline-price quality and are not the primary analysis filter.
- Price and event quality
- QQQ and SPY quality is recorded separately for P0 and every selected P(t) endpoint. Attribution clarity only summarizes headline overlap from 08:15 to 08:45 ET and does not prove causality or identify every scheduled release.
- Rate-bridge data method
ZT 2-Year U.S. Treasury Note futures prices are used to observe short-end Treasury repricing. ZT is not the cash 2-year Treasury yield, and this same-window comparison does not prove a causal transmission sequence.
- Source and schemaDatabento · GLBX.MDP3 · ohlcv-1m · 08:20-09:40 ET
- Contract selection
ZT.v.0is the continuous input symbol. Its mapping selects the most active expiry by previous-day volume and retains original, unadjusted prices. A raw contract is labeled only when metadata resolves a distinct expiry symbol. - Minute mappingZ0 is the close of [08:29, 08:30). Z1/Z5/Z15/Z30/Z60 are the closes of bars ending at 08:31, 08:35, 08:45, 09:00, and 09:30 ET. Every included release must contain all 80 unique one-minute bars in the 08:20–09:40 input window; missing or duplicate bars fail the build, and ZT prices are not carried across missing minutes.
- Price-tick formulaΔ price ticks = (Zt − Z0) × 256. One price tick is 1/256 of a futures price point; it is not one yield basis point.
P0/P15 sensitivity · QQQ median 15-minute return
The strict sample excludes any release whose P0 or P15 endpoint used a latest-valid price. Every affected point is one minute stale; the main cooler/hotter direction remains unchanged.
Strict comparable P0/P15 sample · n=38The overall directional median is close to neutral, but an aggregate result can hide differences across surprise groups. Chapter 3 therefore separates releases by headline/core MoM surprise.
Chapter 3 · Actual vs. consensus
How QQQ/SPY reacted when CPI ran cooler or hotter than expected
Headline and core MoM CPI are compared with historical reported consensus. These buckets use MoM surprise only; accompanying headlines may emphasize YoY or other details and do not determine the bucket.
Reaction window, synced with every chart in Chapter 3
| CPI result | Samples | Headline/Core MoM surprise median | QQQ · 15m price move median | SPY · 15m price move median | QQQ-SPY relative return median | Grouping rule |
|---|---|---|---|---|---|---|
| Cooler | 18 | Headline-0.1ppCore-0.1pp | +0.38%up 77.8% (14)down 16.7% (3)near flat 5.6% (1)Middle 50% +0.04% – +0.45% | +0.24%up 77.8% (14)down 16.7% (3)near flat 5.6% (1)Middle 50% +0.02% – +0.36% | +2.5bp | Both MoM readings are at or below consensus; at least one is lower. |
| In line | 10 | Headline+0.0ppCore+0.0pp | +0.03%up 60.0% (6)down 40.0% (4)near flat 0.0% (0)Middle 50% -0.07% – +0.10% | +0.01%up 50.0% (5)down 50.0% (5)near flat 0.0% (0)Middle 50% -0.05% – +0.06% | +1.8bp | Both MoM readings equal consensus at one-decimal precision. |
| Hotter | 13 | Headline+0.1ppCore+0.1pp | -0.07%up 30.8% (4)down 61.5% (8)near flat 7.7% (1)Middle 50% -0.28% – +0.02% | -0.06%up 46.2% (6)down 53.8% (7)near flat 0.0% (0)Middle 50% -0.21% – +0.03% | -2.2bp | Both MoM readings are at or above consensus; at least one is higher. |
| Mixed | 1 | Headline+0.1ppCore-0.1pp | +0.07%Only one historical sample. Direction probabilities and distribution ranges are not calculated. | +0.07%Only one historical sample. Direction probabilities and distribution ranges are not calculated. | -0.3bp | Headline and core MoM surprises point in opposite directions. |
Small samples are descriptive. The middle 50% range shows uncertainty without implying a forecast interval. Direction counts use near flat at ±0.01%. Path classification later uses a separate ±0.05% muted threshold.
Rate bridge · 15m
Did short-end Treasuries move in the common direction?
ZT 2-Year Treasury Note futures prices show how short-end Treasuries repriced in the same event window. A higher ZT price is generally consistent with lower short-end Treasury yields; a lower ZT price is generally consistent with higher yields. ZT price ticks are not yield basis points.
- Cross-event Pearson correlation · 15m · n=43 · QQQ
- 0.69
- Cross-event Pearson correlation · 15m · n=43 · SPY
- 0.72
Horizontal · ZT price ticks
0-tick referenceGroup medianMiddle 50%ZT upZT downZT near flat
Directional alignment by CPI surprise
ZT moving beyond the threshold in the common price direction counts as aligned; moves inside the threshold are near flat. This is a historical description, not proof of causality. Threshold ±1 price tick.
16/18 aligned · 1 near flat · 1 opposite
8/13 aligned · 0 near flat · 5 opposite
Current-window directional alignment: Cooler 88.9% · Hotter 61.5%.
ZT repricing versus QQQ/SPY reaction
Points toward the upper right combine a higher ZT price with a higher ETF price; points toward the lower left combine declines in both.
Reaction window, synced with every chart in Chapter 3
ZT repricing versus QQQ reaction
updownnear flat
Vertical · post-release price move
ZT price down · consistent with higher short-end Treasury yieldsHorizontal · ZT price ticksZT price up · consistent with lower short-end Treasury yields
ZT repricing versus SPY reaction
updownnear flat
Vertical · post-release price move
ZT price down · consistent with higher short-end Treasury yieldsHorizontal · ZT price ticksZT price up · consistent with lower short-end Treasury yields
Robustness checks
Pearson measures linear co-movement; its 95% confidence interval uses the Fisher z transform on the unrounded correlation. Spearman uses ranks. The remaining rows rerun Pearson after removing the largest absolute ZT move and provider-degraded dates. The threshold table checks whether the cooler-versus-hotter ordering depends on the near-flat cutoff.
| 15m | QQQ | SPY | QQQ−SPY |
|---|---|---|---|
| Pearsonn=43 | 0.6995% CI 0.49–0.82 | 0.7295% CI 0.53–0.84 | 0.2895% CI -0.02–0.54 |
| Spearman rankn=43 | 0.52 | 0.57 | 0.27 |
| Pearson without largest |ZT| eventn=42 | 0.56 | 0.62 | 0.20 |
| Pearson without provider-degraded datesn=42 | 0.69 | 0.72 | 0.28 |
Excluded tail event · Apr 10, 2024, ZT -101 price ticks (largest absolute ZT move).
Excluded degraded dates · Apr 10, 2026.
Alignment after exclusion · Cooler 94.1% (16/17) · Hotter 61.5% (8/13).
Excluding the degraded date leaves the main QQQ/SPY and relative-return correlations nearly unchanged.
ZT aligned more closely with the shared QQQ/SPY direction than with QQQ−SPY relative performance in this window.
Near-flat threshold sensitivity
| Near-flat threshold | Cooler alignment | Hotter alignment |
|---|---|---|
| ±1 price tick | 88.9%16/18 | 61.5%8/13 |
| ±4 price ticks | 88.9%16/18 | 61.5%8/13 |
| ±8 price ticks | 77.8%14/18 | 53.8%7/13 |
The exact rates change with the cutoff; compare the full threshold range before treating the cooler-versus-hotter gap as robust.
Chapter 4 · Event distribution · 15m
Every dot is one official CPI release
The QQQ and SPY scatter plots each keep all 41 comparable releases visible. The horizontal axis shows the selected ETF's post-release move; higher points have a larger combined headline/core surprise. Open a point to replay that date.
Reaction windowAll QQQ/SPY percentages use the close of the final complete pre-release one-minute bar, [08:29, 08:30) ET, as the base and show the post-release price move for the selected window.
CPI surprise intensity versus QQQ reaction
Comparable MoM releases · n=42 · Horizontal axis: QQQ · 15m price move
0% referenceGroup medianQQQ middle 50% of movesQQQ upQQQ downQQQ near flat
Headline/Core equal-weight absolute surprisePage-defined measure: (|Headline surprise| + |Core surprise|) / 2
CPI surprise intensity versus SPY reaction
Comparable MoM releases · n=42 · Horizontal axis: SPY · 15m price move
0% referenceGroup medianSPY middle 50% of movesSPY upSPY downSPY near flat
Headline/Core equal-weight absolute surprisePage-defined measure: (|Headline surprise| + |Core surprise|) / 2
QQQAll official releases · n=43
- up
- 60.5% (26)
- down
- 34.9% (15)
- near flat
- 4.7% (2)
- Median
- +0.04%
- Middle 50%
- -0.06% – +0.38%
- Average absolute price move
- 0.28%
- Middle 80%
- -0.23% – +0.49%
SPYAll official releases · n=43
- up
- 60.5% (26)
- down
- 37.2% (16)
- near flat
- 2.3% (1)
- Median
- +0.05%
- Middle 50%
- -0.05% – +0.27%
- Average absolute price move
- 0.23%
- Middle 80%
- -0.20% – +0.41%
Where the CPI → ZT → equities path held or broke
These examples trace the CPI surprise, the ZT signal, and the selected ETF together. They show an analytical path, not a mechanical prediction rule.
Hotter → ZT and the selected ETF moved in the common direction
ZT -101 price ticks
QQQ -1.83% · SPY -1.72%
Open curveHotter → ZT moved opposite the common direction
ZT +30 price ticks
QQQ -0.10% · SPY -0.08%
Open curveCooler → ZT aligned, but the selected ETF moved opposite
ZT +22 price ticks
QQQ -0.14% · SPY -0.09%
Open curveChapter 5 · Tail events
Official releases worth replaying
QQQ gain rank 1 / 26
March 2023 · Official CPI release
Release data
Headline MoMActual 0.1% · Consensus 0.2% · MoM surprise -0.1ppCore MoMActual 0.4% · Consensus 0.4% · MoM surprise +0.0pp
The bucket uses headline/core MoM surprise only; this report may emphasize YoY or other details.
Accompanying release-time reportMar 2023 CPI: headline MoM 0.1% vs 0.2% consensus; core MoM 0.4% vs 0.4%; headline YoY 5.0%, core YoY 5.6%BLS and consensus sources · 08:30 ET
QQQ 15m +1.07%SPY 15m +0.73%
Open curve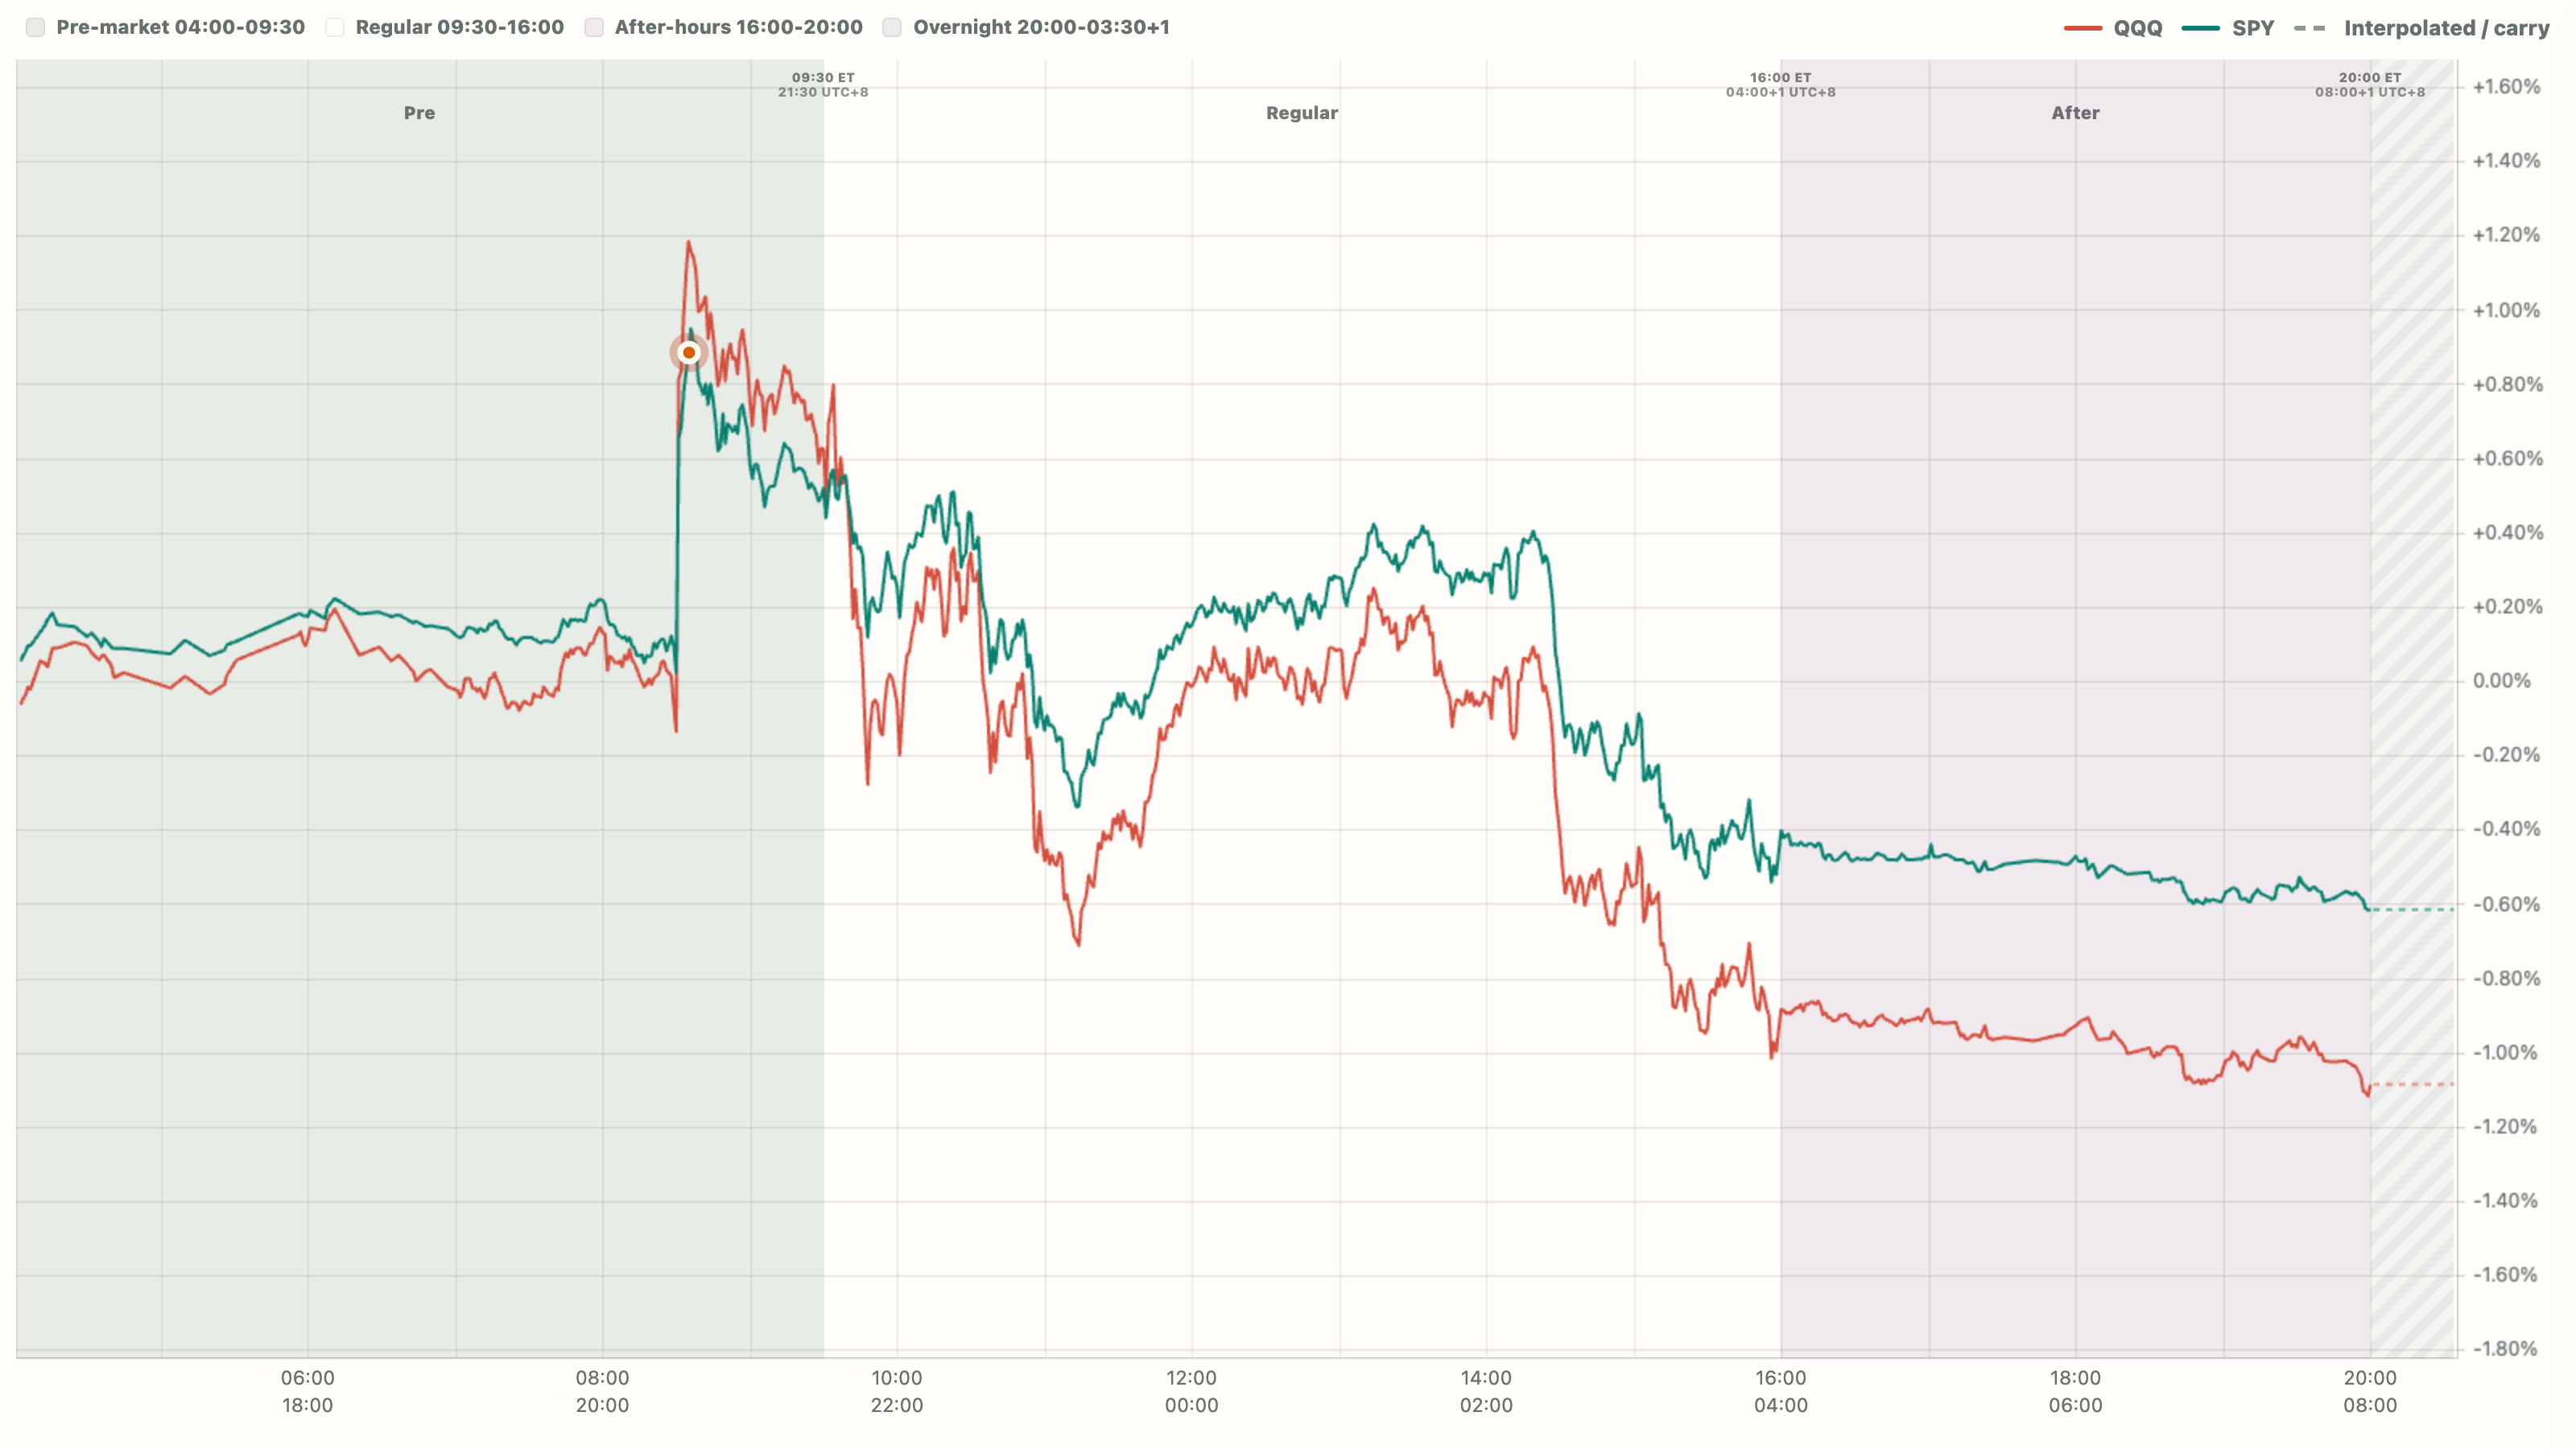
ZT price rose · consistent with lower short-end Treasury yields
- 15m pre-release move
- QQQ -0.15%
- 60m pre-open move
- QQQ +0.76%
- Absolute 15m reaction rank
- 2 / 43
- Price anchor
- Both anchors observed
- Attribution clarity
- Unable to assess
QQQ gain rank 2 / 26
April 2023 · Official CPI release
Release data
Headline MoMActual 0.4% · Consensus 0.4% · MoM surprise +0.0ppCore MoMActual 0.4% · Consensus 0.4% · MoM surprise +0.0pp
The bucket uses headline/core MoM surprise only; this report may emphasize YoY or other details.
Accompanying release-time reportCPI (YoY) (Apr) 4.9% Vs 5% Est.Futubull QQQ/SPY · Benzinga · 08:30 EDT
QQQ 15m +0.92%SPY 15m +0.79%
Open curve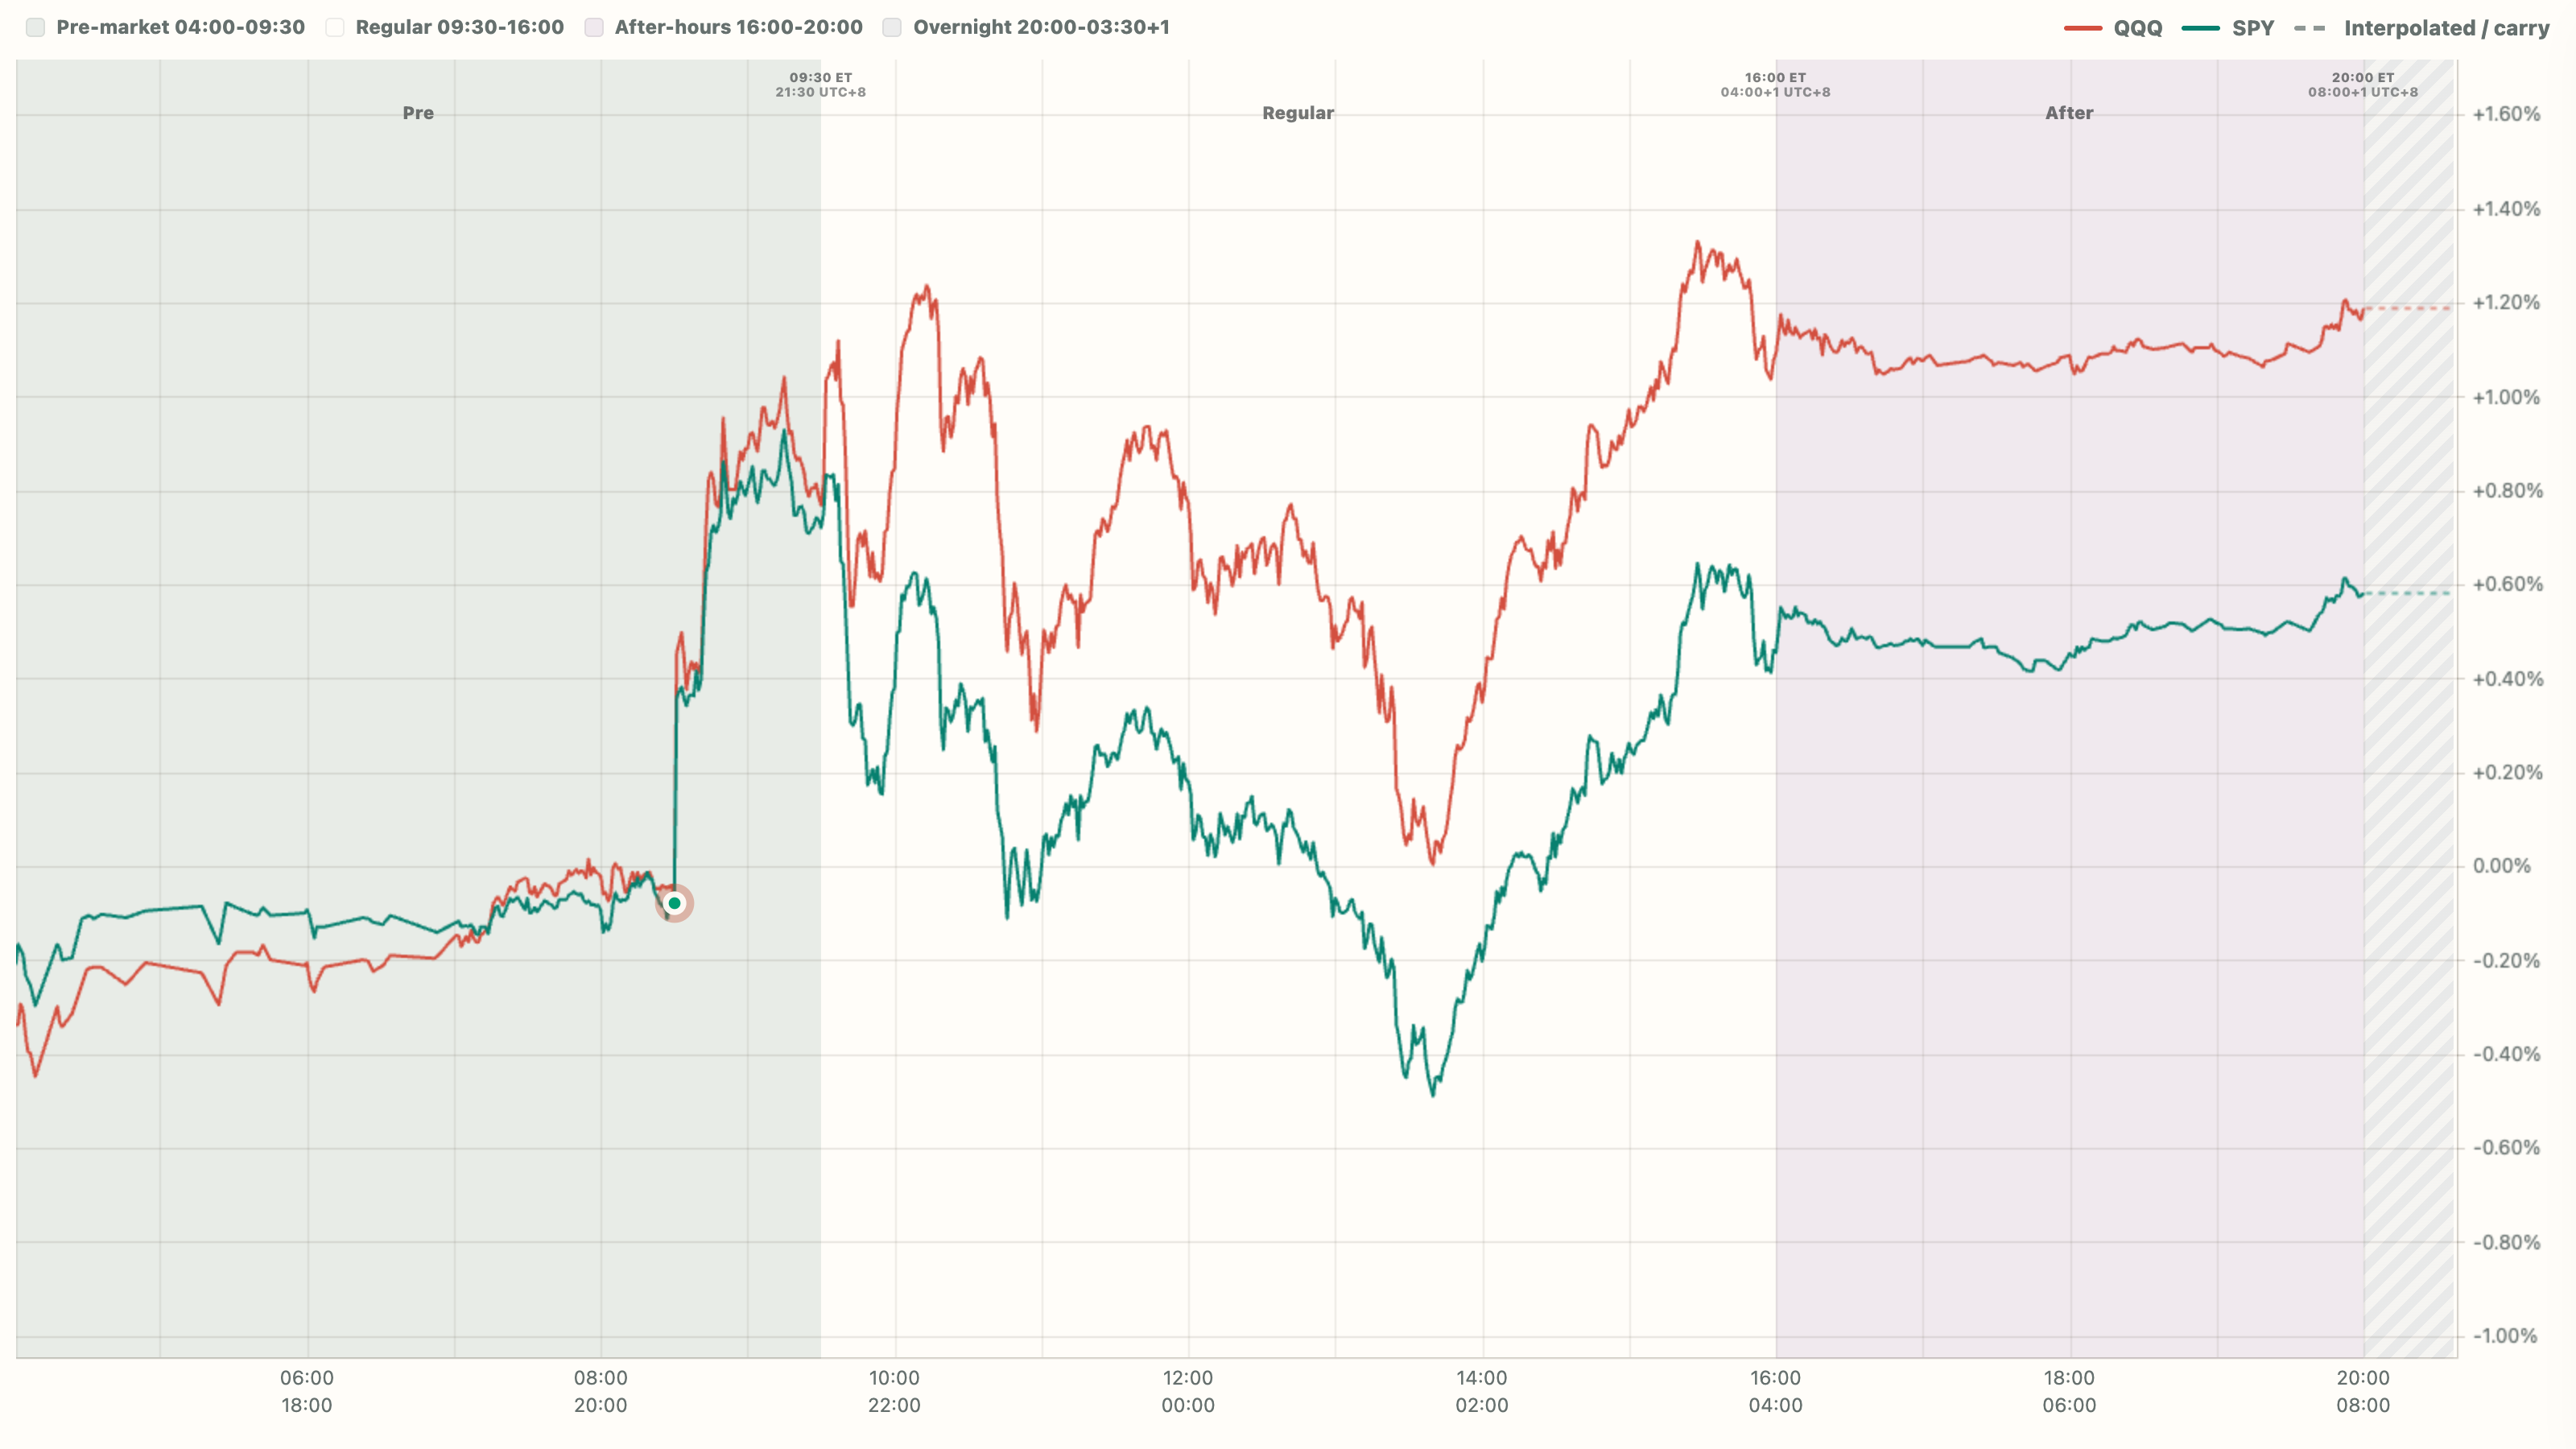
ZT price rose · consistent with lower short-end Treasury yields
- 15m pre-release move
- QQQ -0.07%
- 60m pre-open move
- QQQ +0.85%
- Absolute 15m reaction rank
- 3 / 43
- Price anchor
- Both anchors observed
- Attribution clarity
- Some overlap
QQQ gain rank 3 / 26
May 2026 · Official CPI release
Release data
Headline MoMActual 0.5% · Consensus 0.5% · MoM surprise +0.0ppCore MoMActual 0.2% · Consensus 0.3% · MoM surprise -0.1pp
The bucket uses headline/core MoM surprise only; this report may emphasize YoY or other details.
Accompanying release-time reportUSA Core CPI (MoM) For May 0.2% Vs 0.3% Est.Benzinga · SPY · 08:30 EDT
QQQ 15m +0.60%SPY 15m +0.31%
Open curve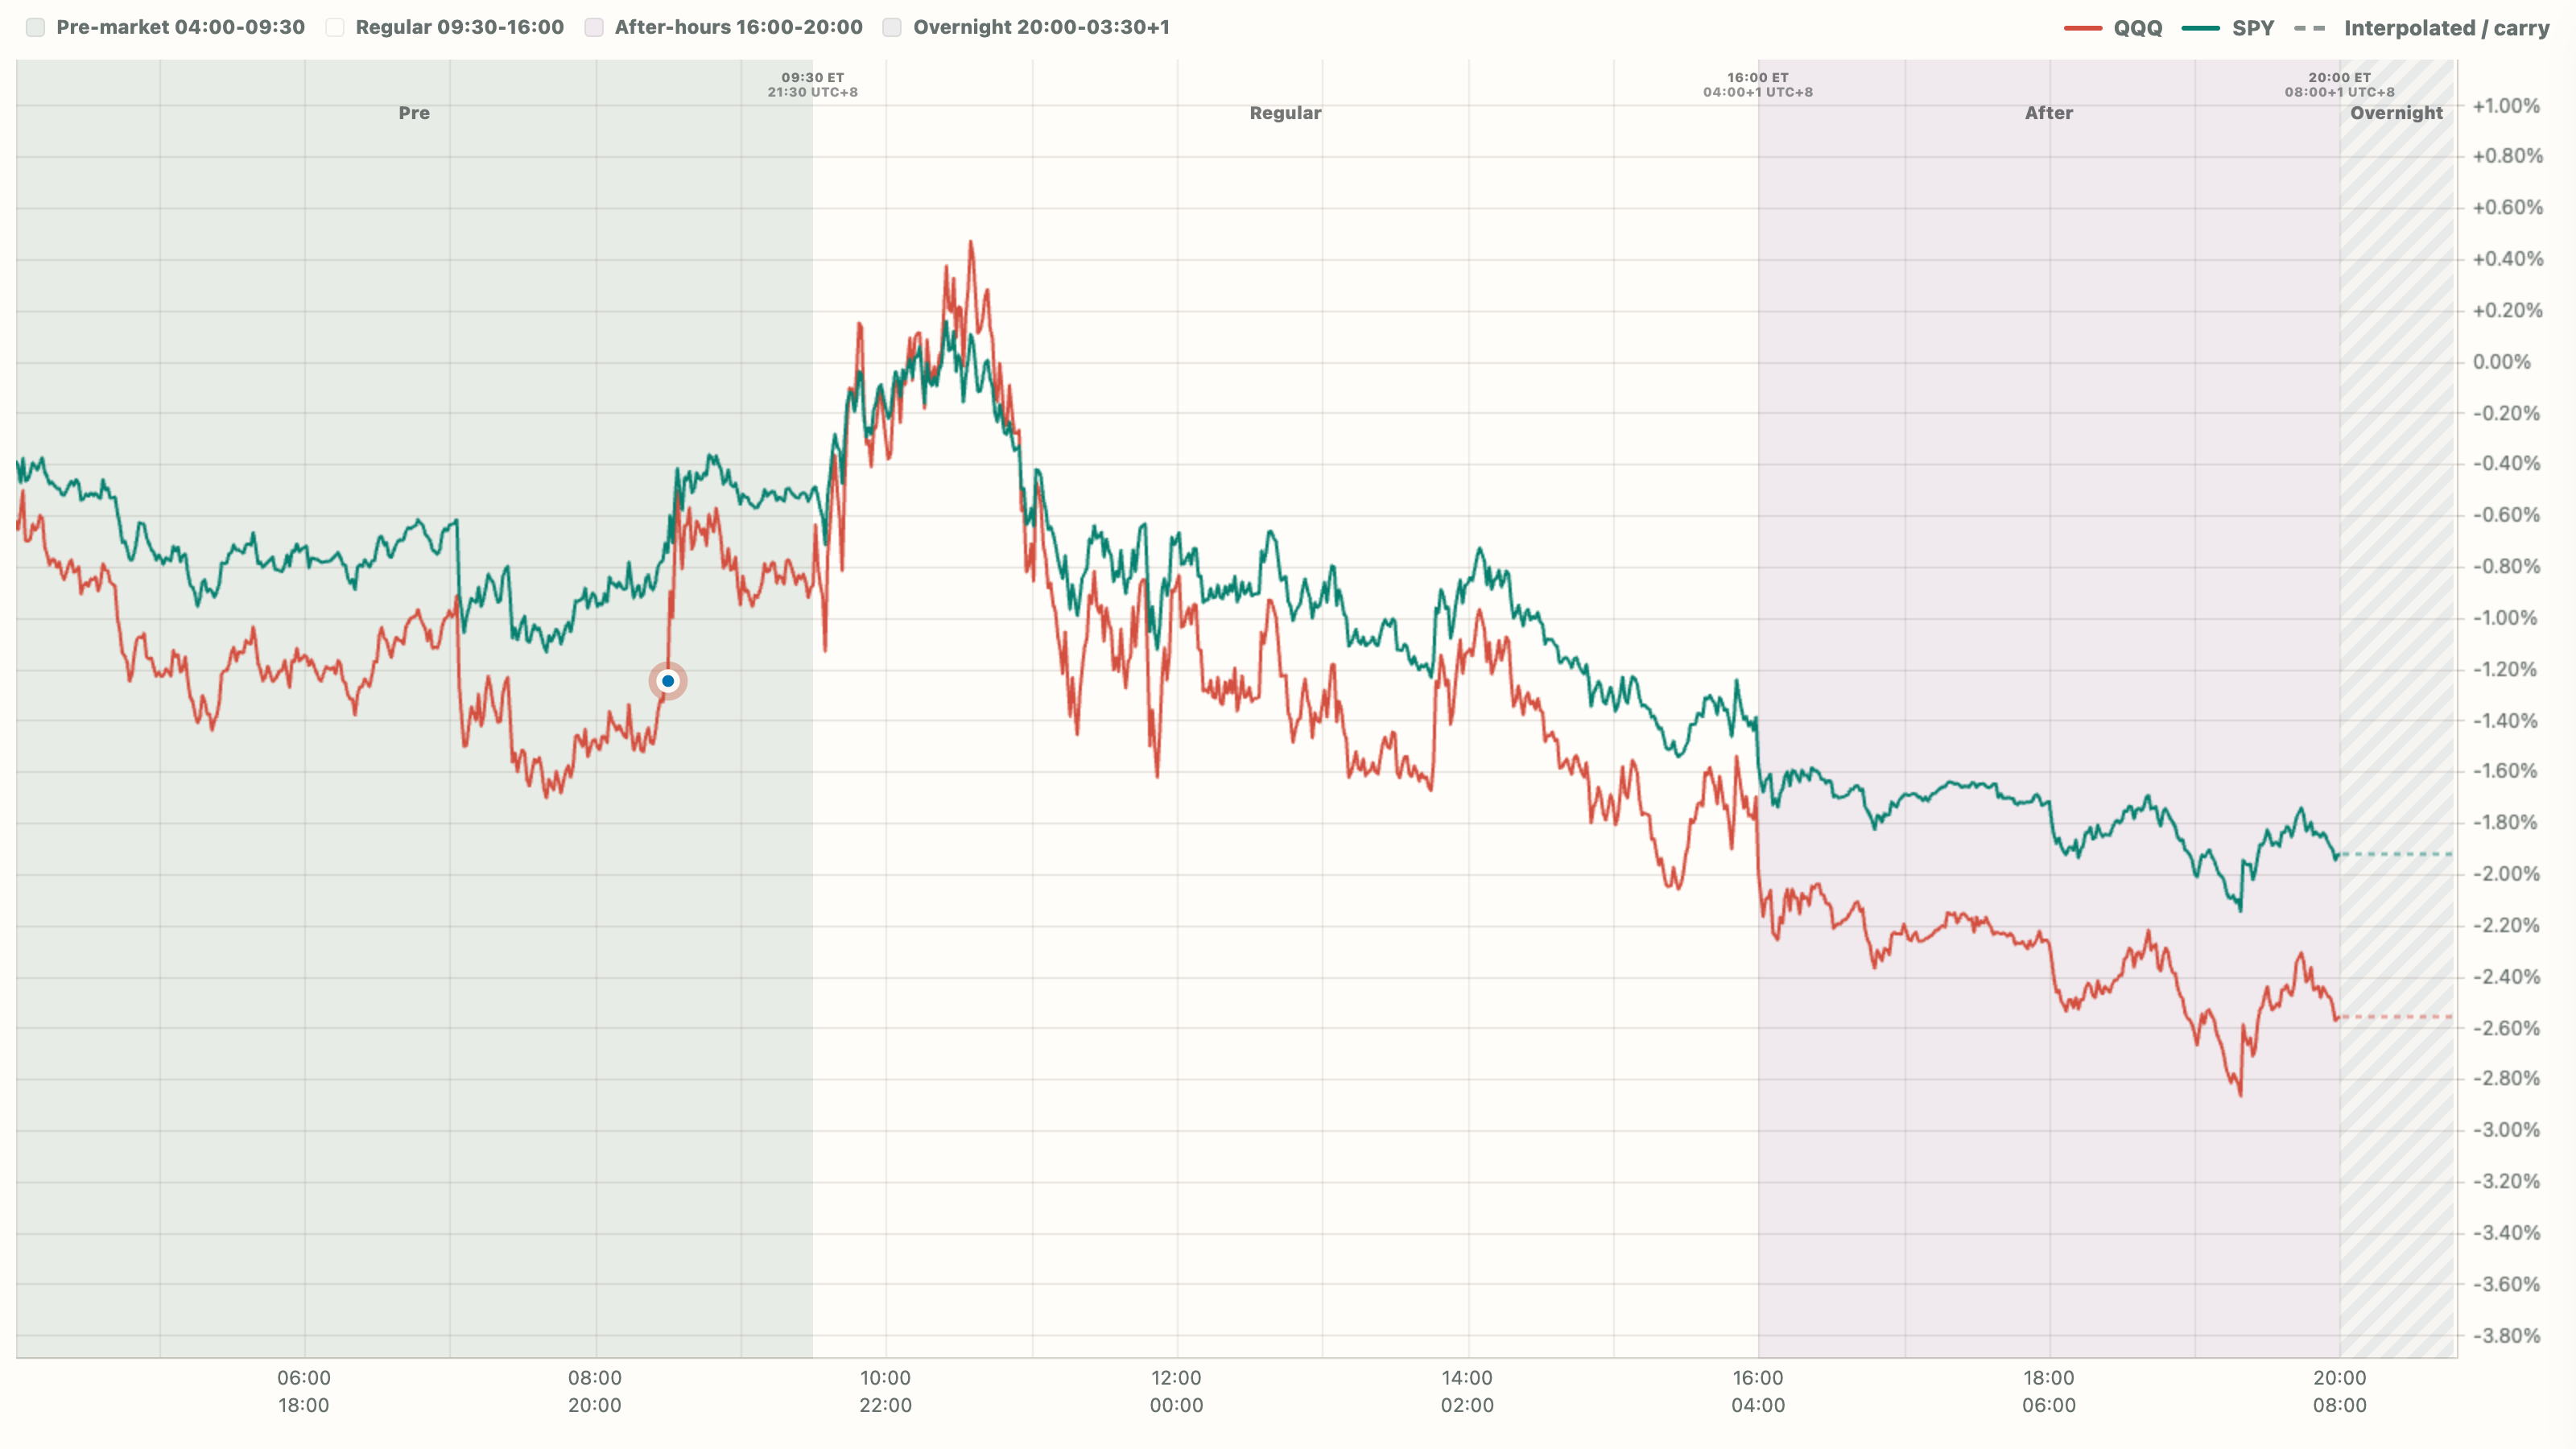
ZT price rose · consistent with lower short-end Treasury yields
- 15m pre-release move
- QQQ +0.19%
- 60m pre-open move
- QQQ +0.37%
- Absolute 15m reaction rank
- 4 / 43
- Price anchor
- Both anchors observed
- Attribution clarity
- Clearer
QQQ gain rank 4 / 26
June 2023 · Official CPI release
Release data
Headline MoMActual 0.2% · Consensus 0.3% · MoM surprise -0.1ppCore MoMActual 0.2% · Consensus 0.3% · MoM surprise -0.1pp
The bucket uses headline/core MoM surprise only; this report may emphasize YoY or other details.
Accompanying release-time reportCPI YoY For June 3.0% Vs 3.1% Expected; 4.0% PriorFutubull SPY · Benzinga · 08:30 EDT
QQQ 15m +0.52%SPY 15m +0.41%
Open curve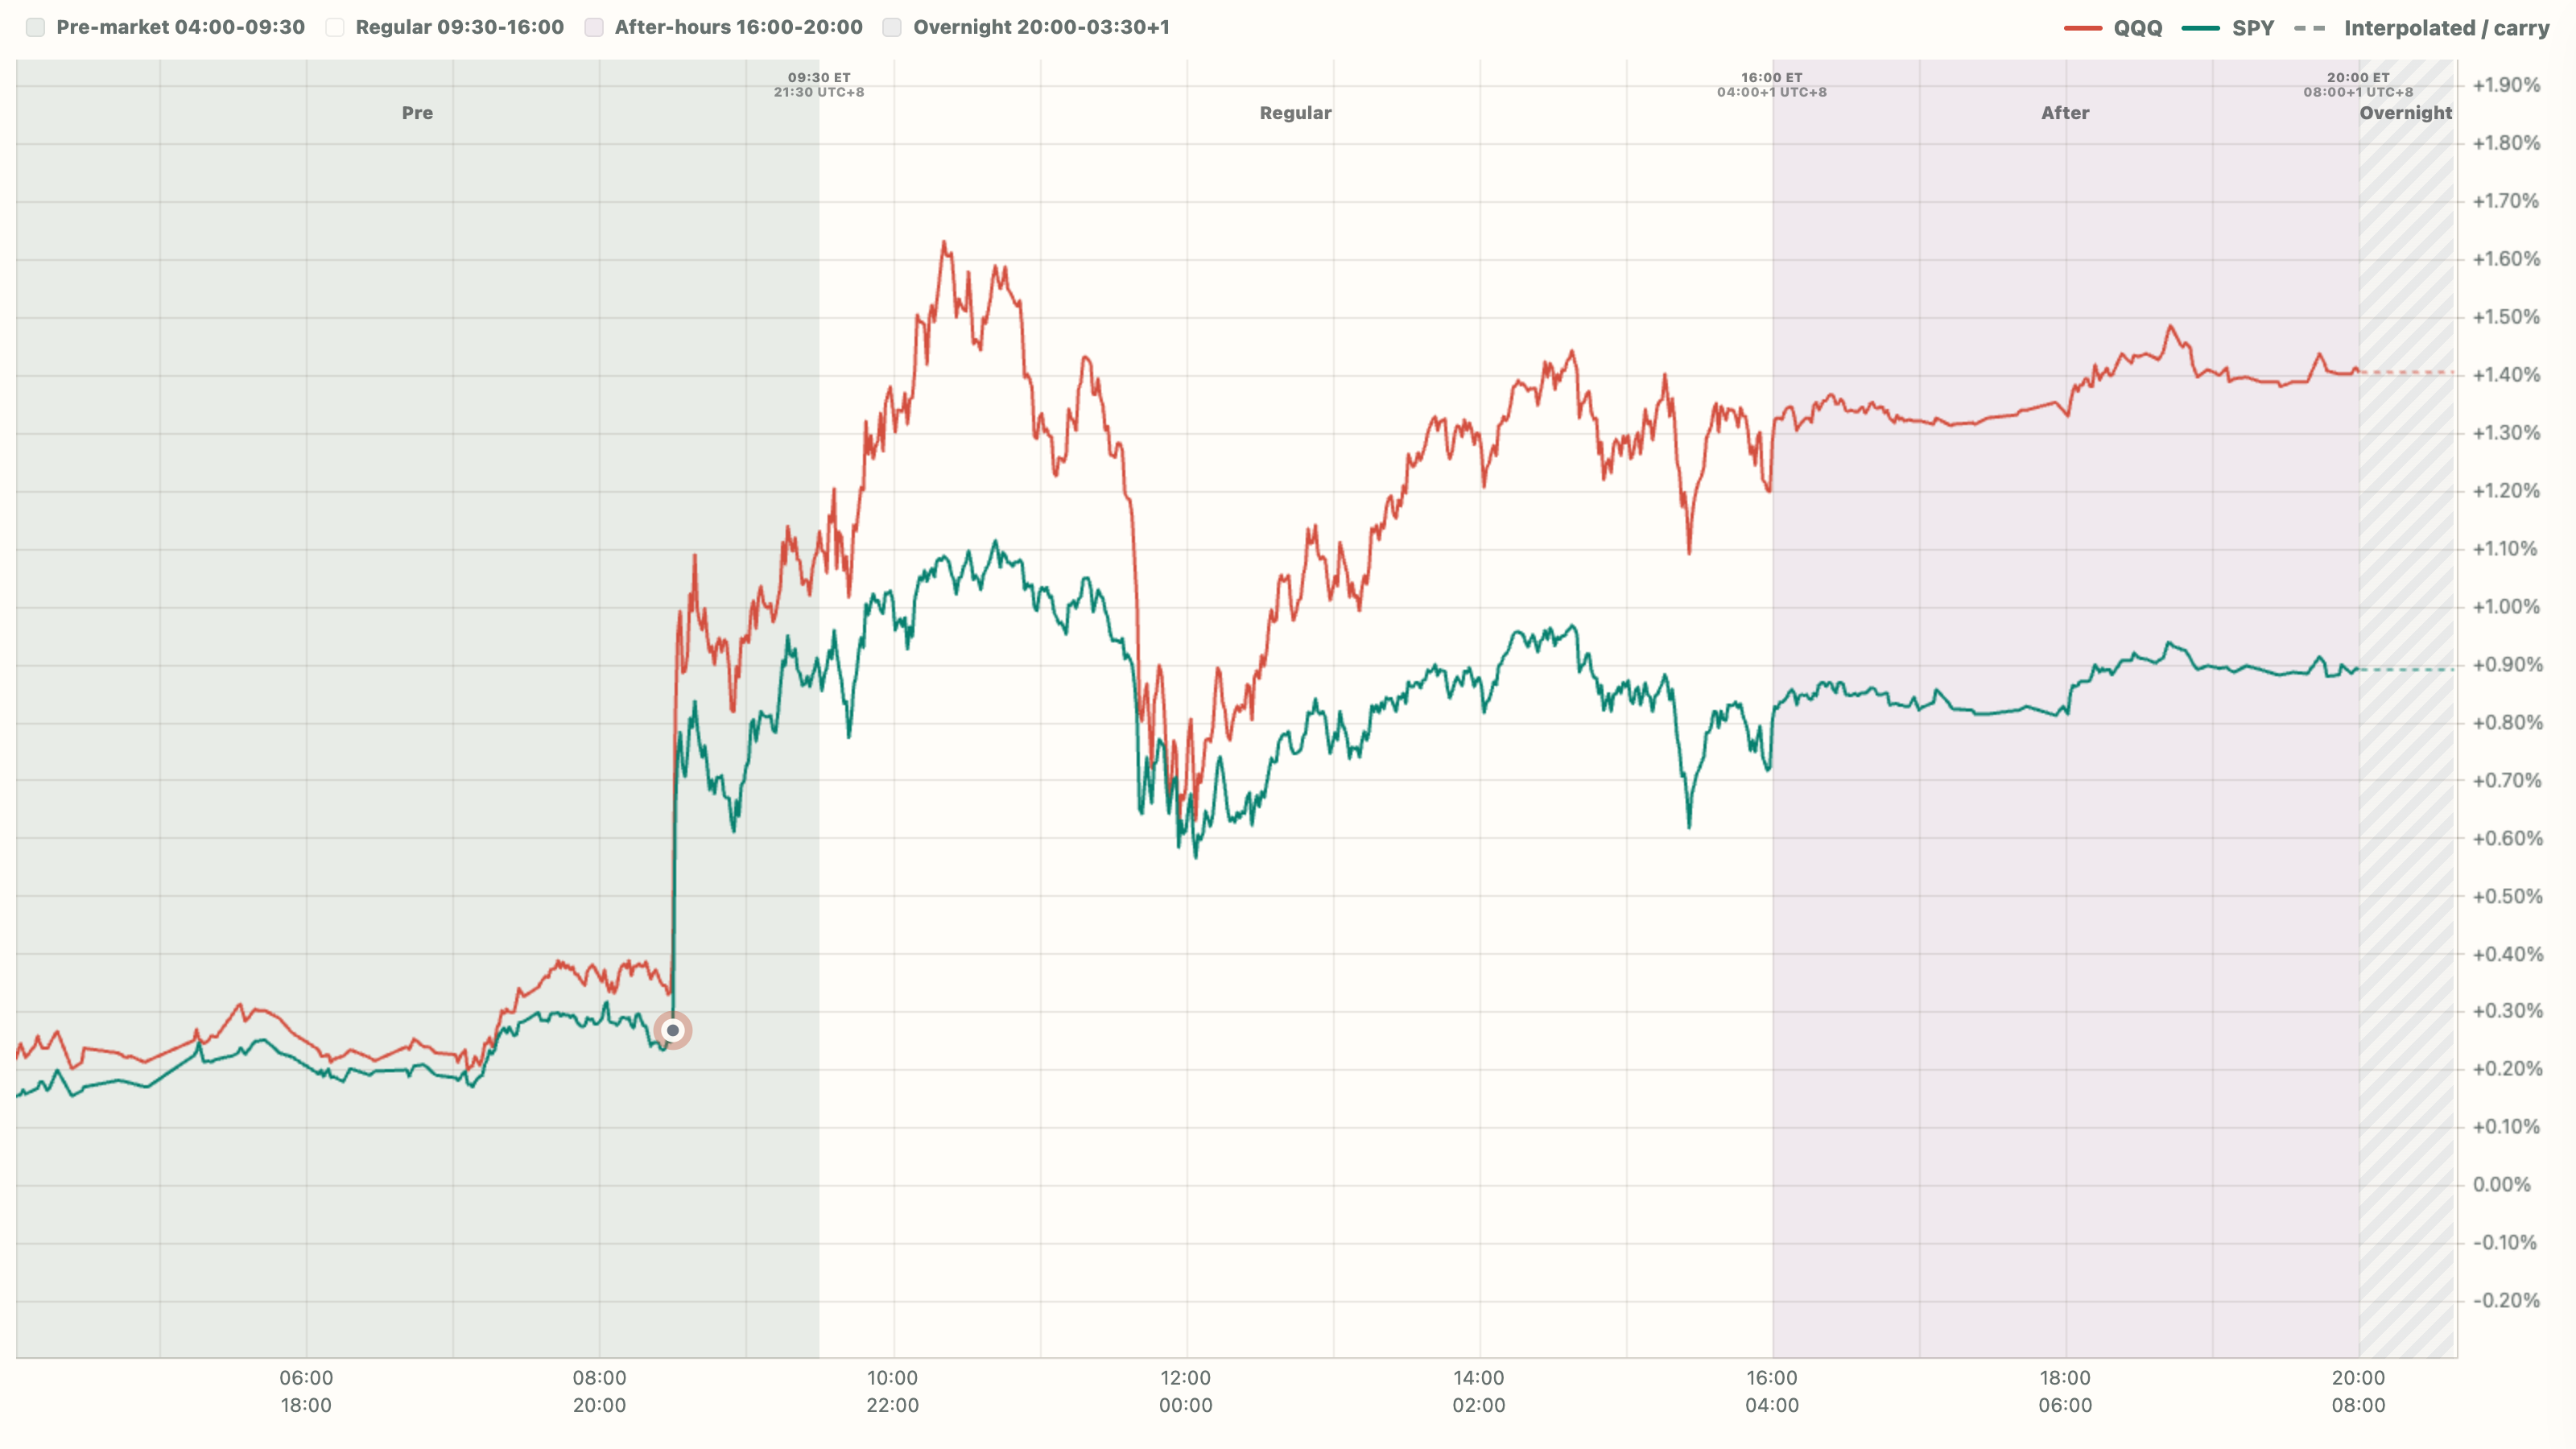
ZT price rose · consistent with lower short-end Treasury yields
- 15m pre-release move
- QQQ +0.02%
- 60m pre-open move
- QQQ +0.72%
- Absolute 15m reaction rank
- 5 / 43
- Price anchor
- Both anchors observed
- Attribution clarity
- Some overlap
QQQ decline rank 1 / 15
March 2024 · Official CPI release
Release data
Headline MoMActual 0.4% · Consensus 0.3% · MoM surprise +0.1ppCore MoMActual 0.4% · Consensus 0.3% · MoM surprise +0.1pp
The bucket uses headline/core MoM surprise only; this report may emphasize YoY or other details.
Accompanying release-time reportExpress News | US Mar. CPI YoY 3.5% Vs 3.4% Forecast, Prior 3.2%Futubull QQQ/SPY · Breakings · 08:30 EDT
QQQ 15m -1.83%SPY 15m -1.72%
Open curve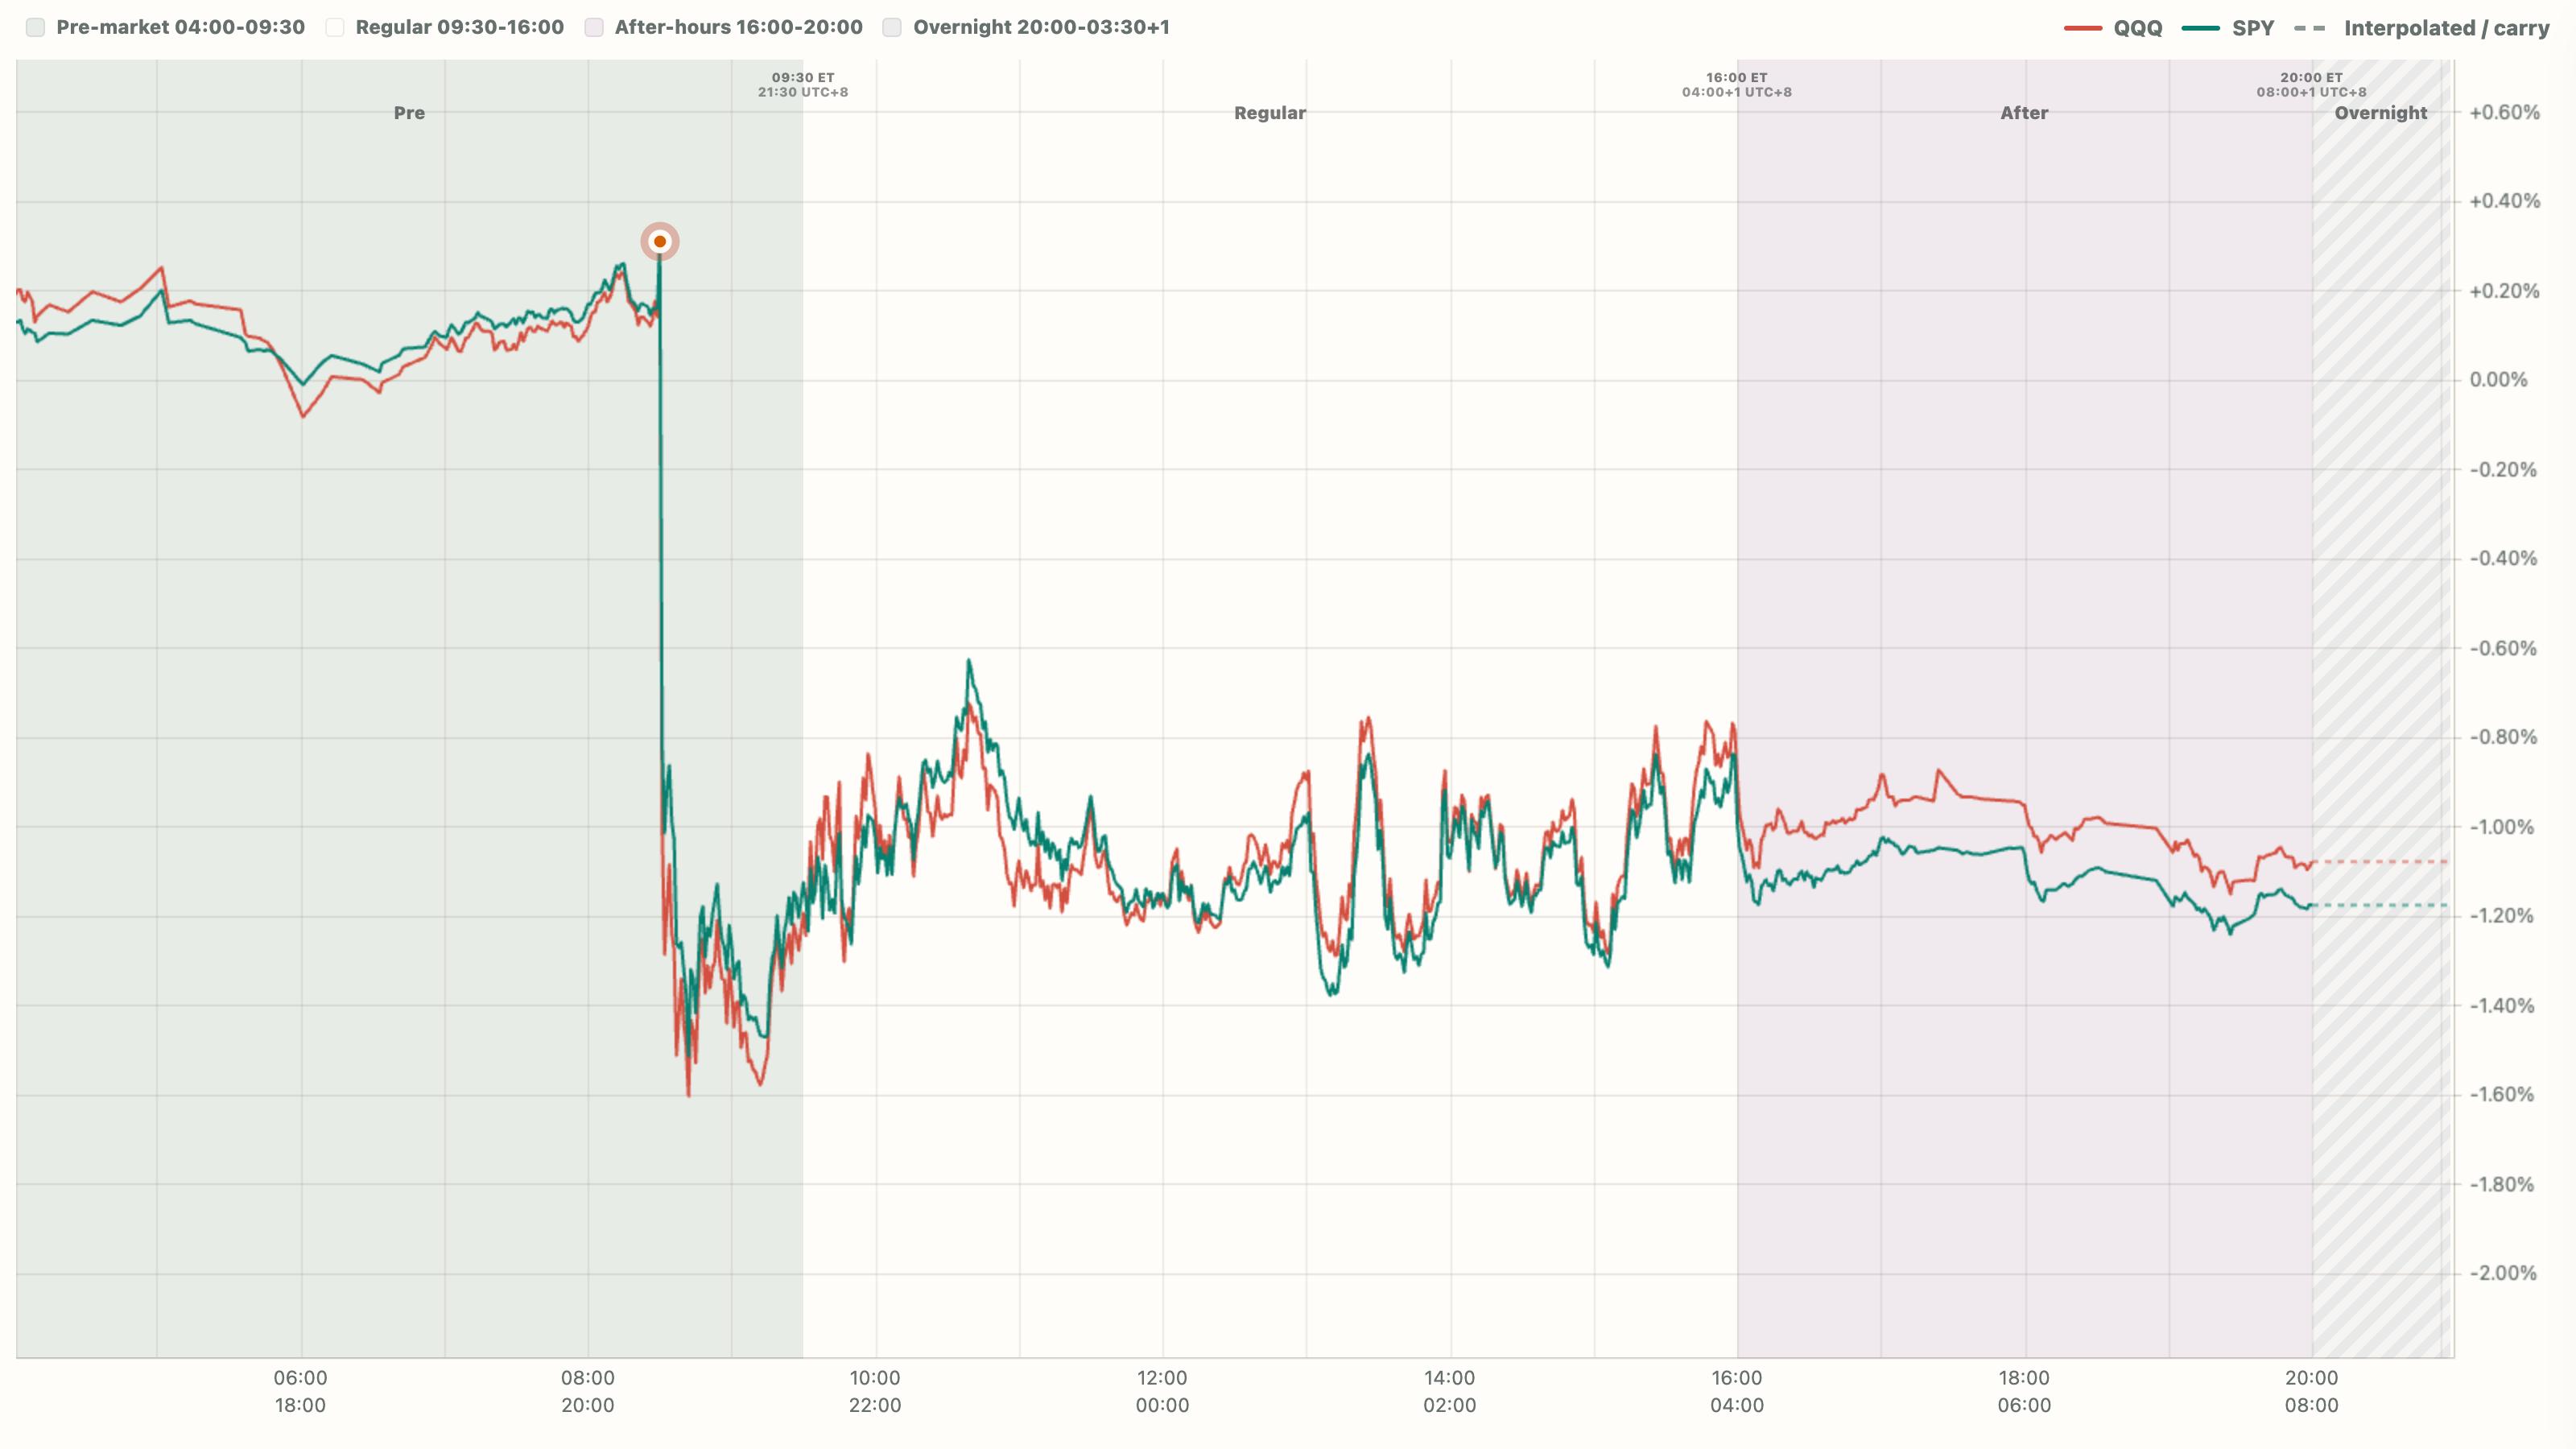
ZT price fell · consistent with higher short-end Treasury yields
- 15m pre-release move
- QQQ +0.07%
- 60m pre-open move
- QQQ -1.50%
- Absolute 15m reaction rank
- 1 / 43
- Price anchor
- Both anchors observed
- Attribution clarity
- Unable to assess
QQQ decline rank 2 / 15
September 2024 · Official CPI release
Release data
Headline MoMActual 0.2% · Consensus 0.1% · MoM surprise +0.1ppCore MoMActual 0.3% · Consensus 0.2% · MoM surprise +0.1pp
The bucket uses headline/core MoM surprise only; this report may emphasize YoY or other details.
Accompanying release-time reportExpress News | US Sep. CPI YoY +2.4% Vs +2.3% Forecast, Prior +2.5%Futubull QQQ/SPY · Breakings · 08:30 EDT
QQQ 15m -0.39%SPY 15m -0.21%
Open curve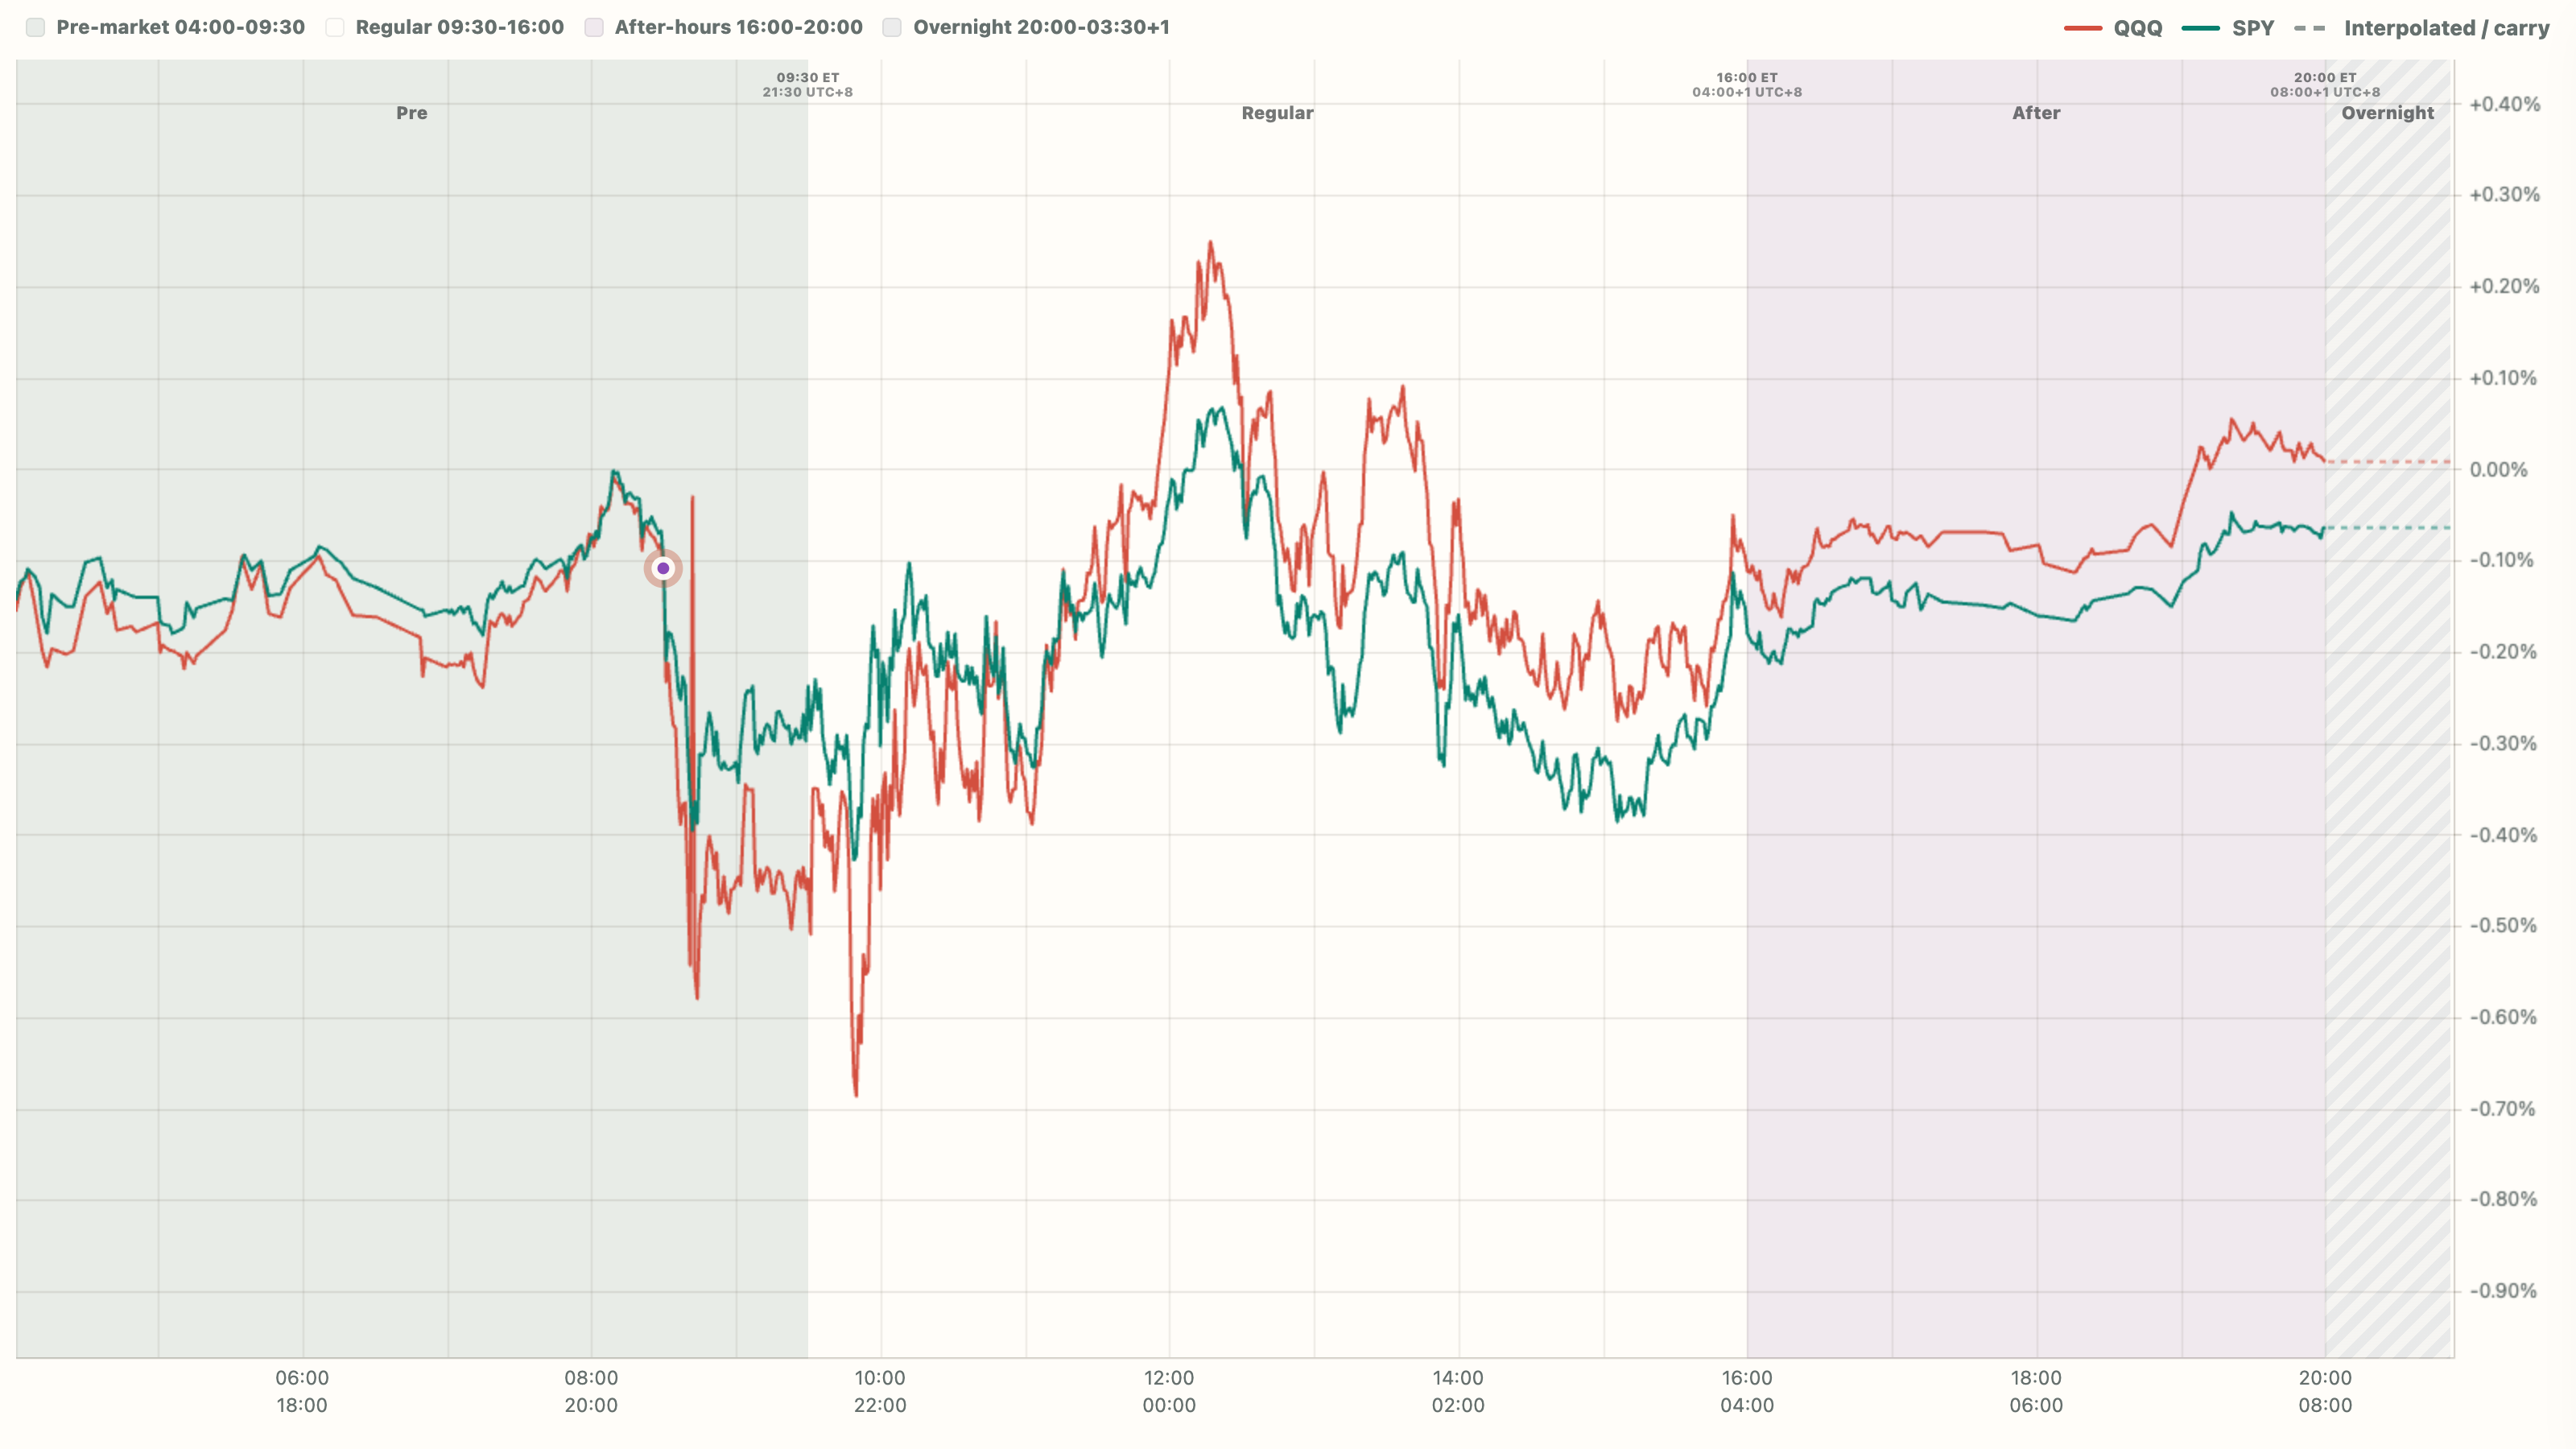
ZT price rose · consistent with lower short-end Treasury yields
- 15m pre-release move
- QQQ -0.07%
- 60m pre-open move
- QQQ -0.34%
- Absolute 15m reaction rank
- 13 / 43
- Price anchor
- Both anchors observed
- Attribution clarity
- Unable to assess
QQQ decline rank 3 / 15
August 2024 · Official CPI release
Release data
Headline MoMActual 0.2% · Consensus 0.2% · MoM surprise +0.0ppCore MoMActual 0.3% · Consensus 0.2% · MoM surprise +0.1pp
The bucket uses headline/core MoM surprise only; this report may emphasize YoY or other details.
Accompanying release-time reportUS CPI (YoY) (Aug) +2.5% Vs +2.5% Est.Futubull SPY · Benzinga · 08:30 EDT
QQQ 15m -0.38%SPY 15m -0.35%
Open curve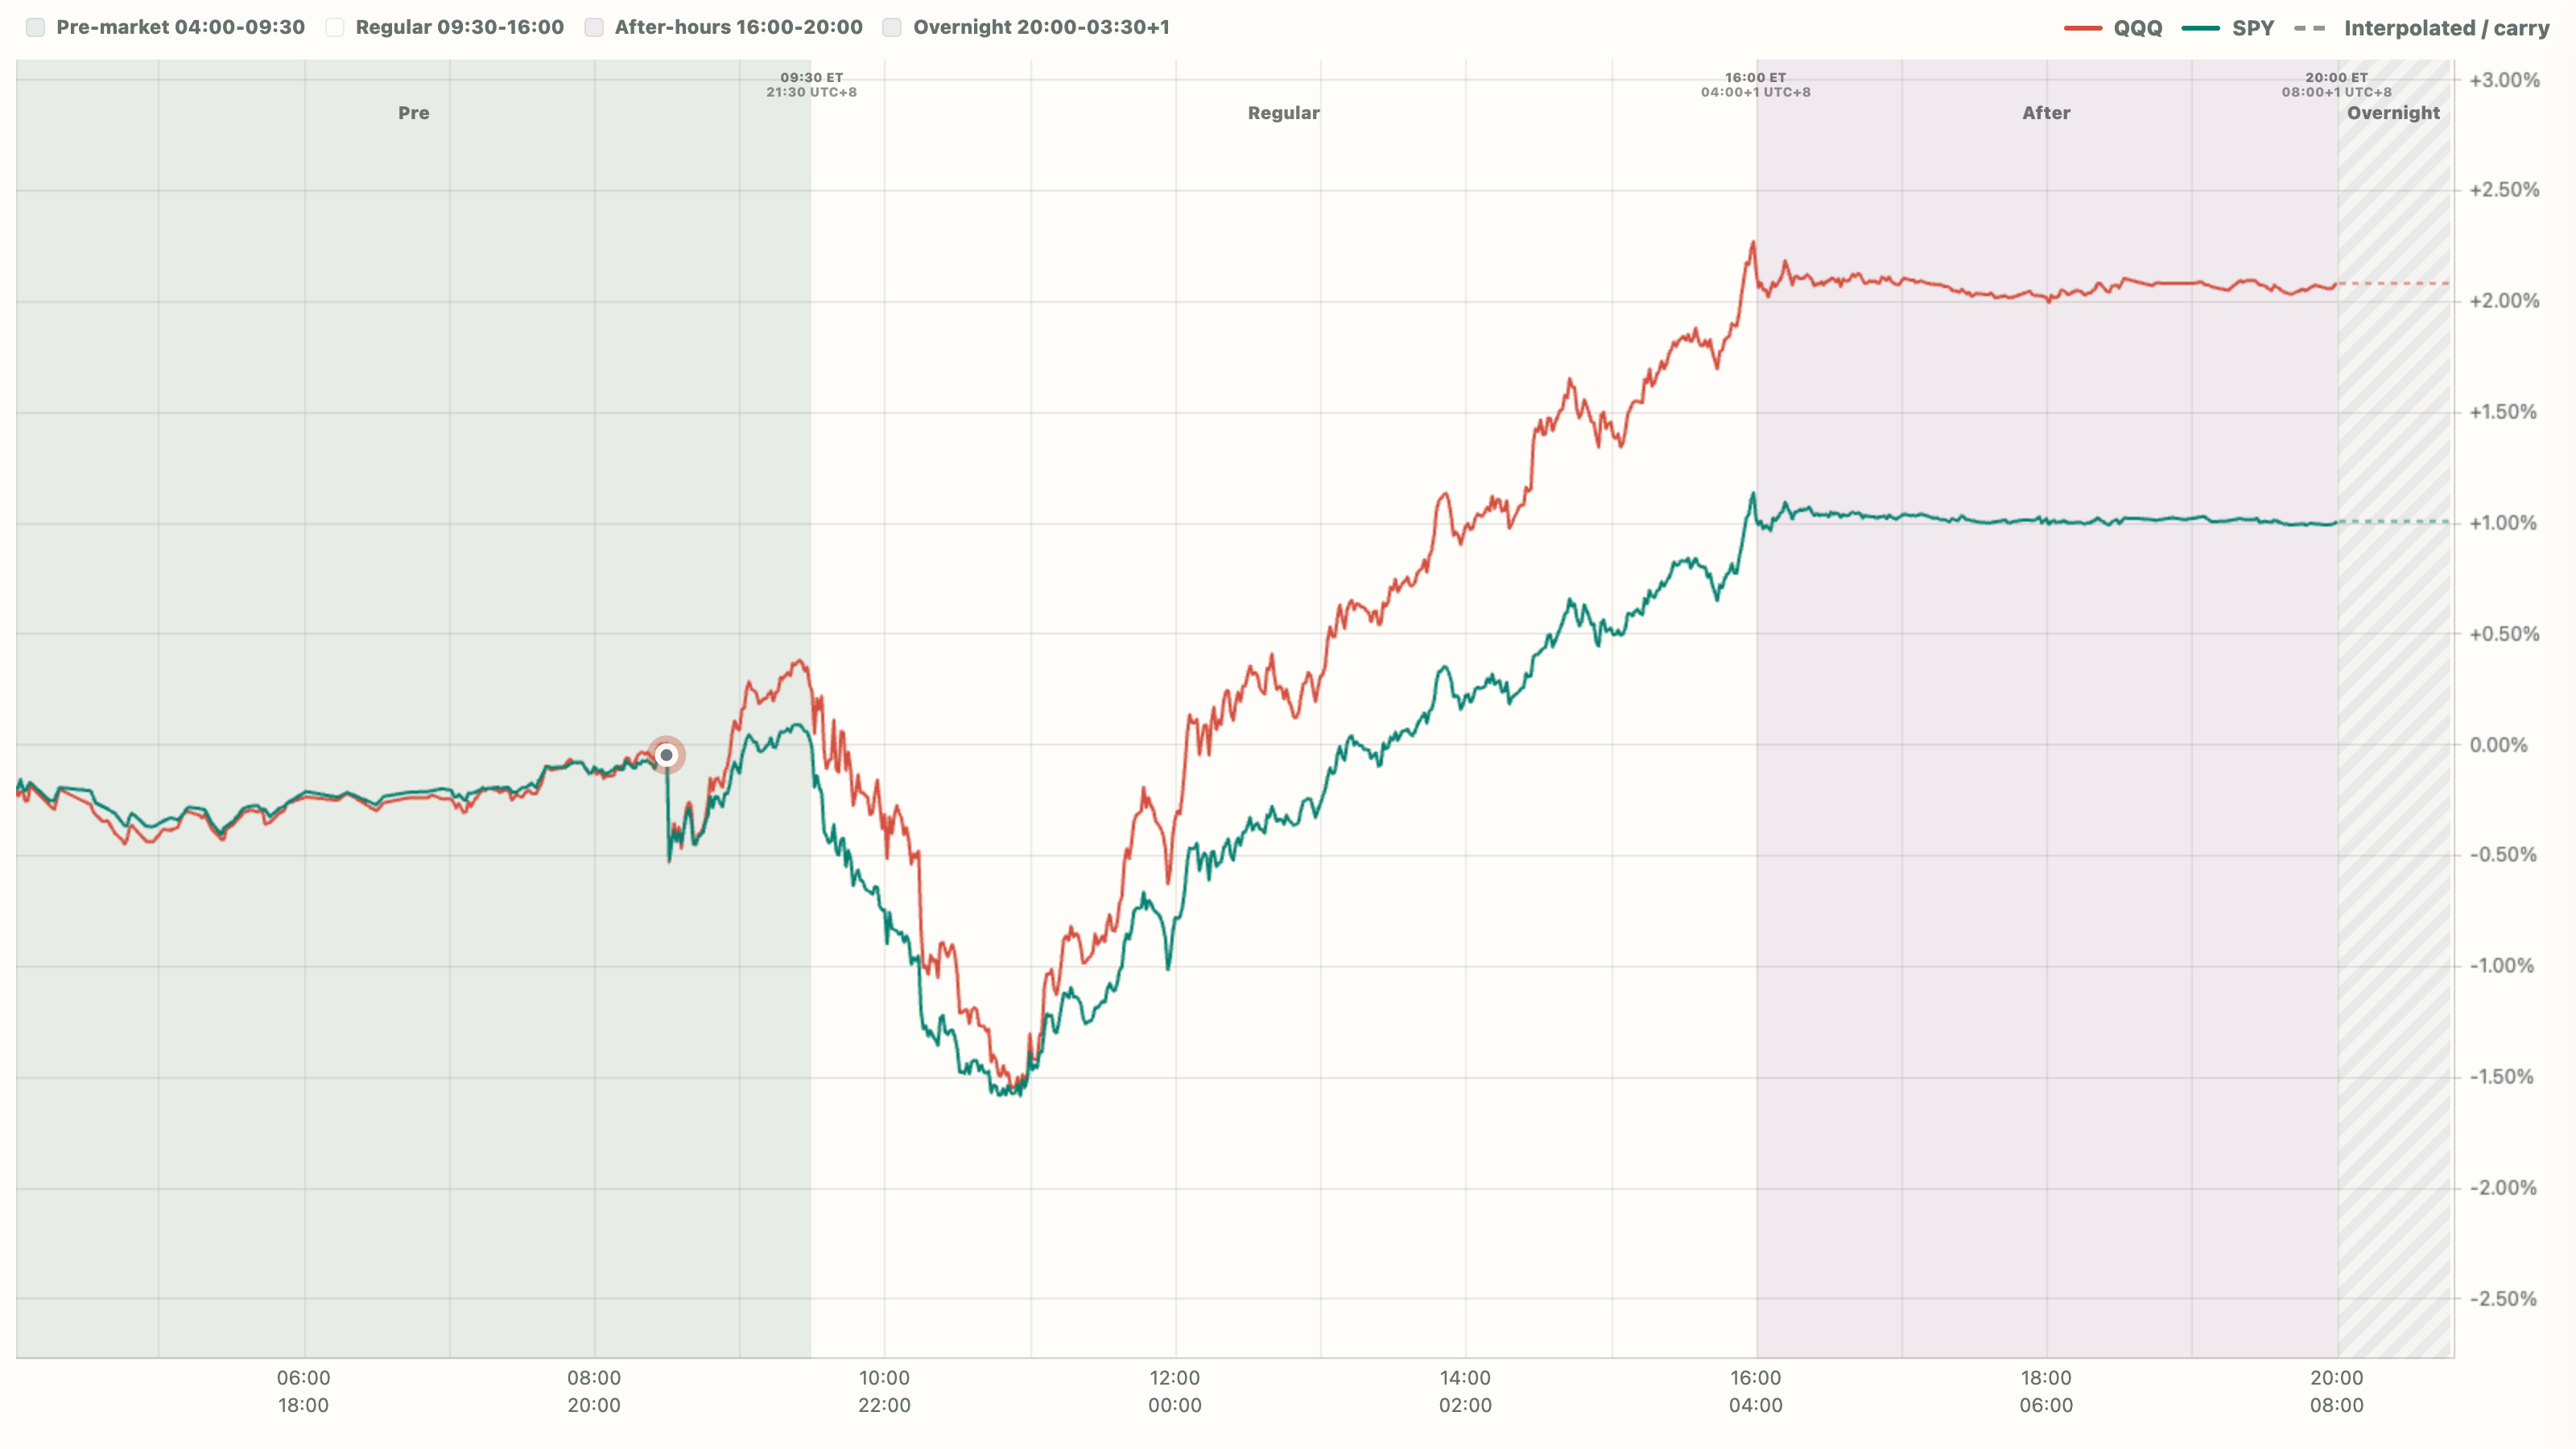
ZT price fell · consistent with higher short-end Treasury yields
- 15m pre-release move
- QQQ +0.09%
- 60m pre-open move
- QQQ +0.23%
- Absolute 15m reaction rank
- 14 / 43
- Price anchor
- Both anchors observed
- Attribution clarity
- Clearer
QQQ decline rank 4 / 15
September 2023 · Official CPI release
Release data
Headline MoMActual 0.4% · Consensus 0.3% · MoM surprise +0.1ppCore MoMActual 0.3% · Consensus 0.3% · MoM surprise +0.0pp
The bucket uses headline/core MoM surprise only; this report may emphasize YoY or other details.
Accompanying release-time reportUSA CPI (MoM) For September 0.4% Vs 0.3% Est.; 0.6% PriorFutubull SPY · Benzinga · 08:30 EDT
QQQ 15m -0.28%SPY 15m -0.29%
Open curve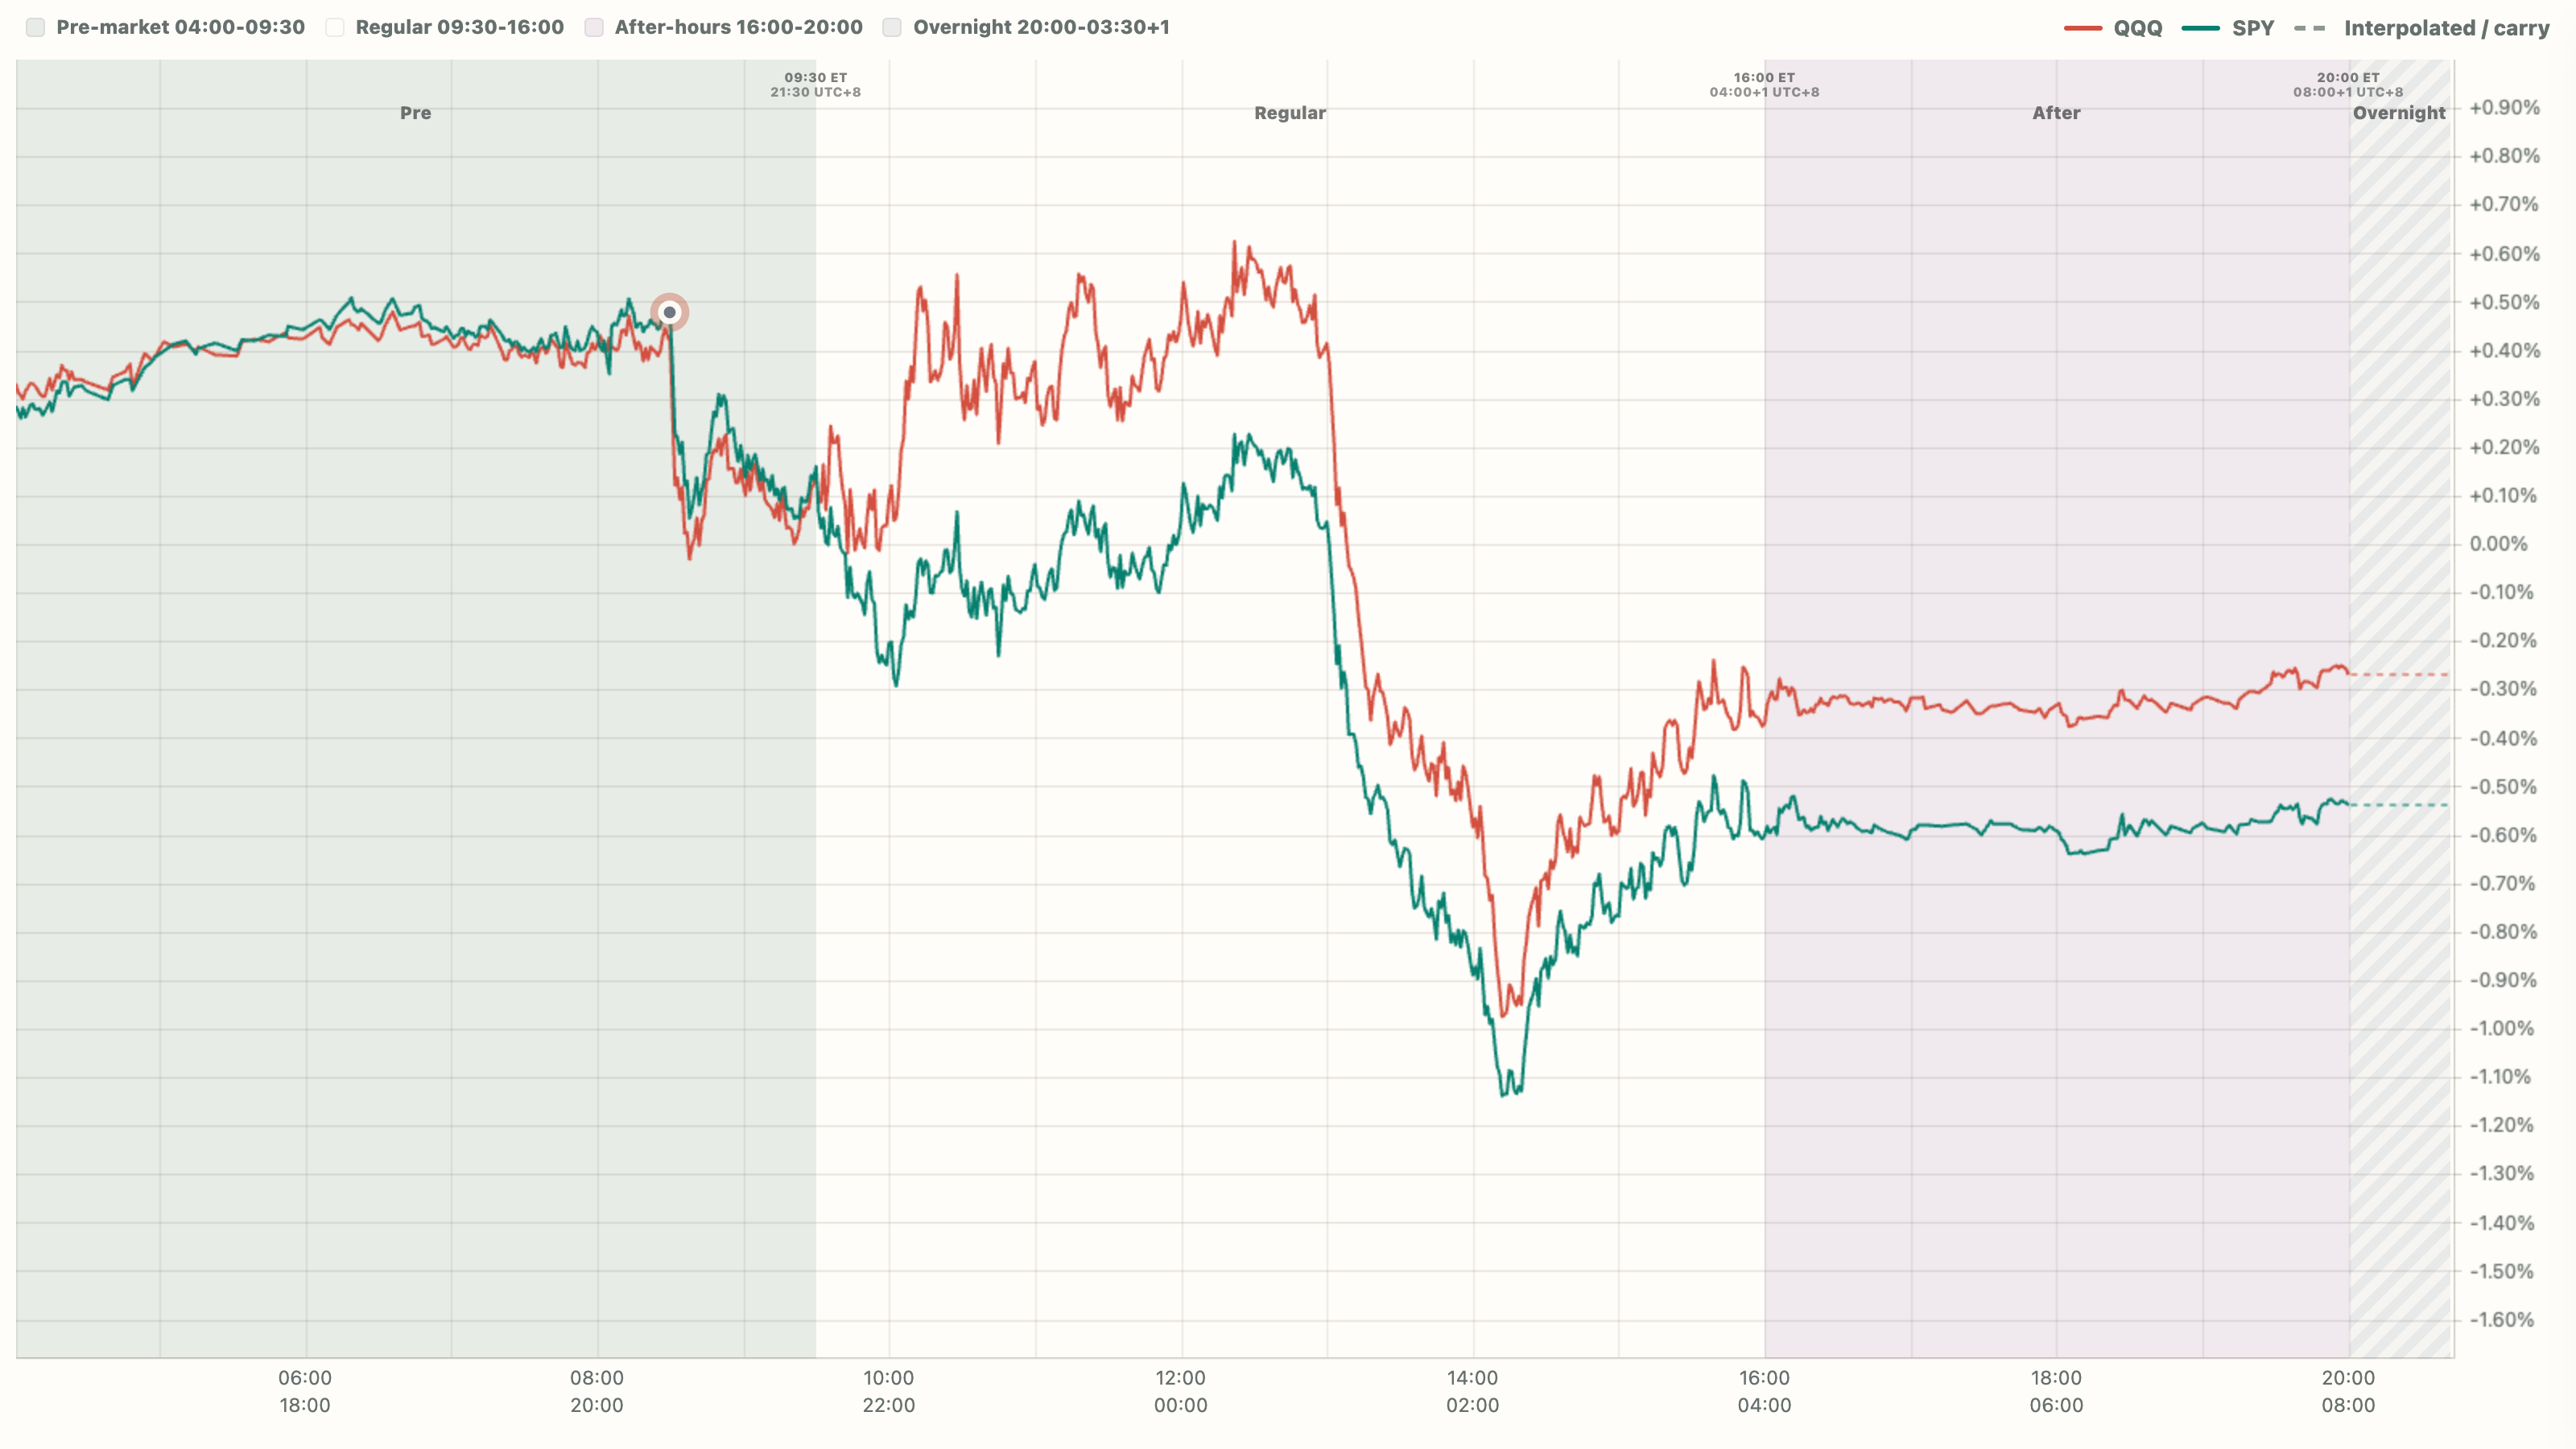
ZT price fell · consistent with higher short-end Treasury yields
- 15m pre-release move
- QQQ -0.01%
- 60m pre-open move
- QQQ -0.27%
- Absolute 15m reaction rank
- 17 / 43
- Price anchor
- Both anchors observed
- Attribution clarity
- Some overlap
Chapter 6 · Official release history
All official CPI release samples
Window comparison
How the release path changes from 1 to 60 minutes
Current sample · n=43
| Window | QQQ median post-release move | QQQ average absolute move | SPY median post-release move | SPY average absolute move | QQQ-SPY median relative return |
|---|---|---|---|---|---|
| 1m | +0.0314% | 0.2823% | +0.0119% | 0.2307% | +0.3bp |
| 5m | +0.0440% | 0.2865% | +0.0116% | 0.2148% | +0.7bp |
| 15m | +0.0414% | 0.2780% | +0.0478% | 0.2273% | +0.5bp |
| 30m | +0.0567% | 0.2615% | +0.0646% | 0.2213% | +1.3bp |
| 60m · pre-open | +0.1236% | 0.2847% | +0.0676% | 0.2179% | +3.4bp |
Reaction window
| Price anchor | Sources | Open curve | |||||||||||
|---|---|---|---|---|---|---|---|---|---|---|---|---|---|
| In line | Jul 2026 | Actual 0.1%Cons. 0.1%Surprise +0.0pp | Actual 0.2%Cons. 0.2%Surprise +0.0pp | +0.04% | +0.05% | -0.6bp | +5 price ticksconsistent with lower short-end Treasury yields | 34 / 43 | P0Both anchors observedP(t) · 15mBoth anchors observed | Muted | Some overlap | BLS actualConsensus reportCross-checked public sources | Open curve |
| Cooler | Jun 2026 | Actual -0.4%Cons. -0.1%Surprise -0.3pp | Actual 0.0%Cons. 0.2%Surprise -0.2pp | +0.45% | +0.36% | +8.9bp | +35 price ticksconsistent with lower short-end Treasury yields | 9 / 43 | P0Both anchors observedP(t) · 15mBoth anchors observed | Faded | Clearer | BLS actualConsensus reportCross-checked public sources | Open curve |
| Cooler | May 2026 | Actual 0.5%Cons. 0.5%Surprise +0.0pp | Actual 0.2%Cons. 0.3%Surprise -0.1pp | +0.60% | +0.31% | +28.9bp | +9 price ticksconsistent with lower short-end Treasury yields | 4 / 43 | P0Both anchors observedP(t) · 15mBoth anchors observed | Faded | Clearer | BLS actualConsensus reportCross-checked public sources | Open curve |
| Hotter | Apr 2026 | Actual 0.6%Cons. 0.6%Surprise +0.0pp | Actual 0.4%Cons. 0.3%Surprise +0.1pp | +0.18% | +0.10% | +7.9bp | +10 price ticksconsistent with lower short-end Treasury yields | 21 / 43 | P0Both anchors observedP(t) · 15mBoth anchors observed | Follow-through | Clearer | BLS actualRelease-time primary metrics | Open curve |
| Cooler | Mar 2026 | Actual 0.9%Cons. 1.0%Surprise -0.1pp | Actual 0.2%Cons. 0.3%Surprise -0.1pp | -0.02% | -0.04% | +1.8bp | -4 price ticksconsistent with higher short-end Treasury yieldsDatabento dataset condition degraded | 38 / 43 | P0Both anchors observedP(t) · 15mBoth anchors observed | Muted | Some overlap | BLS actualRelease-time primary metrics | Open curve |
| In line | Feb 2026 | Actual 0.3%Cons. 0.3%Surprise +0.0pp | Actual 0.2%Cons. 0.2%Surprise +0.0pp | -0.24% | -0.27% | +3.1bp | -8 price ticksconsistent with higher short-end Treasury yields | 19 / 43 | P0Both anchors observedP(t) · 15mBoth anchors observed | Reversal | Some overlap | BLS actualConsensus reportCross-checked public sources | Open curve |
| Cooler | Jan 2026 | Actual 0.2%Cons. 0.3%Surprise -0.1pp | Actual 0.3%Cons. 0.3%Surprise +0.0pp | +0.06% | +0.05% | +1.5bp | -1 price tickprice little changed | 29 / 43 | P0Both anchors observedP(t) · 15mBoth anchors observed | Reversal | Unable to assess | BLS actualConsensus reportCross-checked public sources | Open curve |
| Cooler | Dec 2025 | Actual 0.3%Cons. 0.3%Surprise +0.0pp | Actual 0.2%Cons. 0.3%Surprise -0.1pp | +0.00% | +0.00% | -0.4bp | +12 price ticksconsistent with lower short-end Treasury yields | 43 / 43 | P0Both anchors observedP(t) · 15mBoth anchors observed | Muted | Unable to assess | BLS actualConsensus reportSingle public report | Open curve |
| Special | Nov 2025 | 2m change 0.2% | 2m change 0.2% | +0.03% | -0.02% | +4.4bp | +5 price ticksconsistent with lower short-end Treasury yields | 37 / 43 | P0Both anchors observedP(t) · 15mBoth anchors observed | Muted | Unable to assess | BLS actualNot applicable | Open curve |
| Cooler | Sep 2025 | Actual 0.3%Cons. 0.4%Surprise -0.1pp | Actual 0.2%Cons. 0.3%Surprise -0.1pp | +0.36% | +0.26% | +10.4bp | +26 price ticksconsistent with lower short-end Treasury yields | 16 / 43 | P0Both anchors observedP(t) · 15mBoth anchors observed | Faded | Some overlap | BLS actualConsensus reportSingle public report | Open curve |
| Hotter | Aug 2025 | Actual 0.4%Cons. 0.3%Surprise +0.1pp | Actual 0.3%Cons. 0.3%Surprise +0.0pp | -0.10% | -0.08% | -2.2bp | +30 price ticksconsistent with lower short-end Treasury yields | 24 / 43 | P0Both anchors observedP(t) · 15mBoth anchors observed | Reversal | Some overlap | BLS actualRelease-time primary metrics | Open curve |
| In line | Jul 2025 | Actual 0.2%Cons. 0.2%Surprise +0.0pp | Actual 0.3%Cons. 0.3%Surprise +0.0pp | +0.50% | +0.45% | +4.9bp | +24 price ticksconsistent with lower short-end Treasury yields | 6 / 43 | P0Both anchors observedP(t) · 15mBoth anchors observed | Faded | Clearer | BLS actualRelease-time primary metrics | Open curve |
| Cooler | Jun 2025 | Actual 0.3%Cons. 0.3%Surprise +0.0pp | Actual 0.2%Cons. 0.3%Surprise -0.1pp | +0.06% | +0.07% | -0.9bp | +6 price ticksconsistent with lower short-end Treasury yields | 31 / 43 | P0Both anchors observedP(t) · 15mBoth anchors observed | Follow-through | Some overlap | BLS actualRelease-time primary metrics | Open curve |
| Cooler | May 2025 | Actual 0.1%Cons. 0.2%Surprise -0.1pp | Actual 0.1%Cons. 0.3%Surprise -0.2pp | +0.46% | +0.36% | +9.0bp | +45 price ticksconsistent with lower short-end Treasury yields | 8 / 43 | P0Both anchors observedP(t) · 15mBoth anchors observed | Faded | Clearer | BLS actualConsensus reportCross-checked public sources | Open curve |
| Cooler | Apr 2025 | Actual 0.2%Cons. 0.3%Surprise -0.1pp | Actual 0.2%Cons. 0.3%Surprise -0.1pp | +0.03% | +0.01% | +1.8bp | +6 price ticksconsistent with lower short-end Treasury yields | 35 / 43 | P0Both anchors observedP(t) · 15mBoth anchors observed | Muted | Clearer | BLS actualRelease-time primary metrics | Open curve |
| Cooler | Mar 2025 | Actual -0.1%Cons. 0.1%Surprise -0.2pp | Actual 0.1%Cons. 0.3%Surprise -0.2pp | -0.14% | -0.09% | -5.3bp | +22 price ticksconsistent with lower short-end Treasury yields | 22 / 43 | P0Both anchors observedP(t) · 15mBoth anchors observed | Follow-through | Some overlap | BLS actualRelease-time primary metrics | Open curve |
| Cooler | Feb 2025 | Actual 0.2%Cons. 0.3%Surprise -0.1pp | Actual 0.2%Cons. 0.3%Surprise -0.1pp | +0.39% | +0.09% | +30.7bp | +10 price ticksconsistent with lower short-end Treasury yields | 12 / 43 | P0Both anchors observedP(t) · 15mBoth anchors observed | Follow-through | Some overlap | BLS actualRelease-time primary metrics | Open curve |
| Hotter | Jan 2025 | Actual 0.5%Cons. 0.3%Surprise +0.2pp | Actual 0.4%Cons. 0.3%Surprise +0.1pp | +0.06% | +0.03% | +3.1bp | -44 price ticksconsistent with higher short-end Treasury yields | 30 / 43 | P0Both anchors observedP(t) · 15mBoth anchors observed | Follow-through | Unable to assess | BLS actualConsensus reportSingle public report | Open curve |
| Mixed | Dec 2024 | Actual 0.4%Cons. 0.3%Surprise +0.1pp | Actual 0.2%Cons. 0.3%Surprise -0.1pp | +0.07% | +0.07% | -0.3bp | +28 price ticksconsistent with lower short-end Treasury yields | 28 / 43 | P0Both anchors observedP(t) · 15mBoth anchors observed | Faded | Unable to assess | BLS actualConsensus reportSingle public report | Open curve |
| In line | Nov 2024 | Actual 0.3%Cons. 0.3%Surprise +0.0pp | Actual 0.3%Cons. 0.3%Surprise +0.0pp | -0.03% | -0.03% | +0.4bp | +21 price ticksconsistent with lower short-end Treasury yields | 36 / 43 | P0Both anchors observedP(t) · 15mSPY latest valid 1m | Muted | Unable to assess | BLS actualConsensus reportSingle public report | Open curve |
| In line | Oct 2024 | Actual 0.2%Cons. 0.2%Surprise +0.0pp | Actual 0.3%Cons. 0.3%Surprise +0.0pp | -0.08% | -0.06% | -2.9bp | +31 price ticksconsistent with lower short-end Treasury yields | 26 / 43 | P0Both anchors observedP(t) · 15mQQQ latest valid 1m | Faded | Unable to assess | BLS actualConsensus reportSingle public report | Open curve |
| Hotter | Sep 2024 | Actual 0.2%Cons. 0.1%Surprise +0.1pp | Actual 0.3%Cons. 0.2%Surprise +0.1pp | -0.39% | -0.21% | -17.8bp | +19 price ticksconsistent with lower short-end Treasury yields | 13 / 43 | P0Both anchors observedP(t) · 15mBoth anchors observed | Faded | Unable to assess | BLS actualConsensus reportCross-checked public sources | Open curve |
| Hotter | Aug 2024 | Actual 0.2%Cons. 0.2%Surprise +0.0pp | Actual 0.3%Cons. 0.2%Surprise +0.1pp | -0.38% | -0.35% | -3.0bp | -55 price ticksconsistent with higher short-end Treasury yields | 14 / 43 | P0Both anchors observedP(t) · 15mBoth anchors observed | Reversal | Clearer | BLS actualConsensus reportCross-checked public sources | Open curve |
| In line | Jul 2024 | Actual 0.2%Cons. 0.2%Surprise +0.0pp | Actual 0.2%Cons. 0.2%Surprise +0.0pp | +0.11% | +0.05% | +5.7bp | -14 price ticksconsistent with higher short-end Treasury yields | 23 / 43 | P0Both anchors observedP(t) · 15mBoth anchors observed | Faded | Clearer | BLS actualRelease-time primary metrics | Open curve |
| Cooler | Jun 2024 | Actual -0.1%Cons. 0.1%Surprise -0.2pp | Actual 0.1%Cons. 0.2%Surprise -0.1pp | +0.28% | +0.29% | -0.5bp | +56 price ticksconsistent with lower short-end Treasury yields | 18 / 43 | P0Both anchors observedP(t) · 15mBoth anchors observed | Faded | Some overlap | BLS actualRelease-time primary metrics | Open curve |
| Cooler | May 2024 | Actual 0.0%Cons. 0.1%Surprise -0.1pp | Actual 0.2%Cons. 0.3%Surprise -0.1pp | +0.47% | +0.54% | -6.5bp | +61 price ticksconsistent with lower short-end Treasury yields | 7 / 43 | P0Both anchors observedP(t) · 15mBoth anchors observed | Follow-through | Some overlap | BLS actualRelease-time primary metrics | Open curve |
| Cooler | Apr 2024 | Actual 0.3%Cons. 0.4%Surprise -0.1pp | Actual 0.3%Cons. 0.3%Surprise +0.0pp | +0.44% | +0.40% | +3.2bp | +25 price ticksconsistent with lower short-end Treasury yields | 11 / 43 | P0Both anchors observedP(t) · 15mBoth anchors observed | Follow-through | Some overlap | BLS actualConsensus reportSingle public report | Open curve |
| Hotter | Mar 2024 | Actual 0.4%Cons. 0.3%Surprise +0.1pp | Actual 0.4%Cons. 0.3%Surprise +0.1pp | -1.83% | -1.72% | -11.6bp | -101 price ticksconsistent with higher short-end Treasury yields | 1 / 43 | P0Both anchors observedP(t) · 15mBoth anchors observed | Faded | Unable to assess | BLS actualConsensus reportSingle public report | Open curve |
| Hotter | Feb 2024 | Actual 0.4%Cons. 0.4%Surprise +0.0pp | Actual 0.4%Cons. 0.3%Surprise +0.1pp | +0.36% | +0.33% | +3.6bp | +16 price ticksconsistent with lower short-end Treasury yields | 15 / 43 | P0Both anchors observedP(t) · 15mBoth anchors observed | Faded | Some overlap | BLS actualRelease-time primary metrics | Open curve |
| Hotter | Jan 2024 | Actual 0.3%Cons. 0.2%Surprise +0.1pp | Actual 0.4%Cons. 0.3%Surprise +0.1pp | -0.02% | +0.02% | -4.0bp | -67 price ticksconsistent with higher short-end Treasury yields | 41 / 43 | P0Both anchors observedP(t) · 15mBoth anchors observed | Muted | Unable to assess | BLS actualConsensus reportSingle public report | Open curve |
| Hotter | Dec 2023 | Actual 0.3%Cons. 0.2%Surprise +0.1pp | Actual 0.3%Cons. 0.2%Surprise +0.1pp | +0.00% | +0.01% | -0.8bp | -14 price ticksconsistent with higher short-end Treasury yields | 42 / 43 | P0Both anchors observedP(t) · 15mBoth anchors observed | Muted | Unable to assess | BLS actualConsensus reportSingle public report | Open curve |
| Hotter | Nov 2023 | Actual 0.1%Cons. 0.0%Surprise +0.1pp | Actual 0.3%Cons. 0.3%Surprise +0.0pp | +0.02% | +0.06% | -3.8bp | -25 price ticksconsistent with higher short-end Treasury yields | 40 / 43 | P0SPY latest valid 1mP(t) · 15mBoth anchors observed | Muted | Unable to assess | BLS actualConsensus reportSingle public report | Open curve |
| Cooler | Oct 2023 | Actual 0.0%Cons. 0.1%Surprise -0.1pp | Actual 0.2%Cons. 0.3%Surprise -0.1pp | -0.04% | -0.05% | +0.0bp | +76 price ticksconsistent with lower short-end Treasury yields | 33 / 43 | P0Both anchors observedP(t) · 15mBoth anchors observed | Muted | Unable to assess | BLS actualConsensus reportSingle public report | Open curve |
| Hotter | Sep 2023 | Actual 0.4%Cons. 0.3%Surprise +0.1pp | Actual 0.3%Cons. 0.3%Surprise +0.0pp | -0.28% | -0.29% | +0.5bp | -41 price ticksconsistent with higher short-end Treasury yields | 17 / 43 | P0Both anchors observedP(t) · 15mBoth anchors observed | Faded | Some overlap | BLS actualConsensus reportSingle public report | Open curve |
| Hotter | Aug 2023 | Actual 0.6%Cons. 0.6%Surprise +0.0pp | Actual 0.3%Cons. 0.2%Surprise +0.1pp | -0.20% | -0.15% | -4.6bp | +7 price ticksconsistent with lower short-end Treasury yields | 20 / 43 | P0Both anchors observedP(t) · 15mBoth anchors observed | Reversal | Some overlap | BLS actualRelease-time primary metrics | Open curve |
| In line | Jul 2023 | Actual 0.2%Cons. 0.2%Surprise +0.0pp | Actual 0.2%Cons. 0.2%Surprise +0.0pp | +0.02% | -0.18% | +20.1bp | -28 price ticksconsistent with higher short-end Treasury yields | 39 / 43 | P0Both anchors observedP(t) · 15mBoth anchors observed | Muted | Clearer | BLS actualConsensus reportSingle public report | Open curve |
| Cooler | Jun 2023 | Actual 0.2%Cons. 0.3%Surprise -0.1pp | Actual 0.2%Cons. 0.3%Surprise -0.1pp | +0.52% | +0.41% | +10.2bp | +40 price ticksconsistent with lower short-end Treasury yields | 5 / 43 | P0Both anchors observedP(t) · 15mBoth anchors observed | Follow-through | Some overlap | BLS actualConsensus reportCross-checked public sources | Open curve |
| Cooler | May 2023 | Actual 0.1%Cons. 0.2%Surprise -0.1pp | Actual 0.4%Cons. 0.4%Surprise +0.0pp | +0.44% | +0.23% | +21.4bp | +19 price ticksconsistent with lower short-end Treasury yields | 10 / 43 | P0Both anchors observedP(t) · 15mBoth anchors observed | Faded | Clearer | BLS actualConsensus reportSingle public report | Open curve |
| In line | Apr 2023 | Actual 0.4%Cons. 0.4%Surprise +0.0pp | Actual 0.4%Cons. 0.4%Surprise +0.0pp | +0.92% | +0.79% | +12.9bp | +50 price ticksconsistent with lower short-end Treasury yields | 3 / 43 | P0Both anchors observedP(t) · 15mBoth anchors observed | Faded | Some overlap | BLS actualRelease-time primary metrics | Open curve |
| Cooler | Mar 2023 | Actual 0.1%Cons. 0.2%Surprise -0.1pp | Actual 0.4%Cons. 0.4%Surprise +0.0pp | +1.07% | +0.73% | +33.4bp | +69 price ticksconsistent with lower short-end Treasury yields | 2 / 43 | P0Both anchors observedP(t) · 15mBoth anchors observed | Faded | Unable to assess | BLS actualConsensus reportSingle public report | Open curve |
| Hotter | Feb 2023 | Actual 0.4%Cons. 0.4%Surprise +0.0pp | Actual 0.5%Cons. 0.4%Surprise +0.1pp | -0.07% | -0.06% | -1.0bp | -6 price ticksconsistent with higher short-end Treasury yields | 27 / 43 | P0Both anchors observedP(t) · 15mBoth anchors observed | Reversal | Some overlap | BLS actualConsensus reportSingle public report | Open curve |
| In line | Jan 2023 | Actual 0.5%Cons. 0.5%Surprise +0.0pp | Actual 0.4%Cons. 0.4%Surprise +0.0pp | -0.10% | -0.03% | -6.9bp | -17 price ticksconsistent with higher short-end Treasury yields | 25 / 43 | P0QQQ latest valid 1mP(t) · 15mBoth anchors observed | Follow-through | Unable to assess | BLS actualConsensus reportSingle public report | Open curve |
| In line | Dec 2022 | Actual -0.1%Cons. -0.1%Surprise +0.0pp | Actual 0.3%Cons. 0.3%Surprise +0.0pp | +0.06% | +0.06% | -0.5bp | -1 price tickprice little changed | 32 / 43 | P0Both anchors observedP(t) · 15mBoth anchors observed | Reversal | Unable to assess | BLS actualConsensus reportSingle public report | Open curve |
Chapter 7 · Data range and feedback
Coverage, update date, and corrections
This page is a historical event study, not investment advice. If you spot a wrong CPI value, a missing latest release, or an analysis issue, send feedback and include the release date if possible.
- Release range
- Jan 12, 2023 to Aug 12, 2026
- Official releases
- 43
- Edited
- Aug 15, 2026
- Release calendar
- www.bls.gov